Figures & data
Figure 1 Patient subgroups based on self-measured PIF readings.
Note: Data from Mahler et al.Citation18
Abbreviation: PIF, peak inspiratory flow.
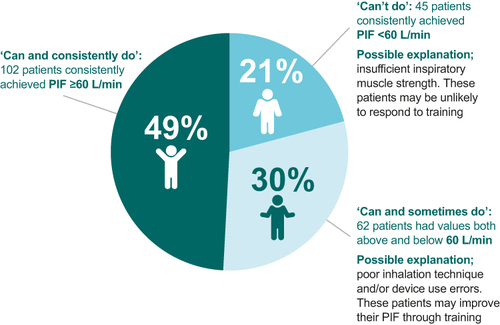
Figure 2 (a) overall distribution of PIF values and (b) range between highest and lowest PIF value (by PIF subgroup based upon self-measured PIF readings over 28 days).
Note: Data from Mahler et al.Citation18
Abbreviation: PIF, peak inspiratory flow.
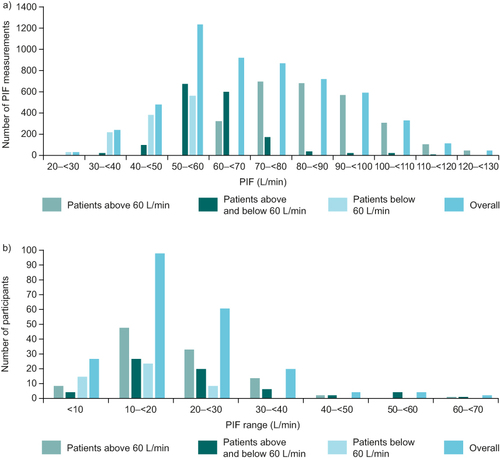
Table 1 Trend Analysis for Baseline Characteristics Across the PIF Range Quartiles
Figure 3 Difference in PIF between at-home and in-clinic visits.a
Notes: aA single measurement was taken in the clinic and a mean value for the respective week at home (seven measurements per patient). Data from Mahler et al.Citation19 Error bars depict standard error.
Abbreviations: BL, baseline; PIF, peak inspiratory flow.
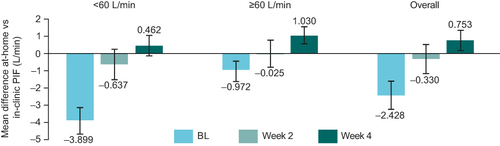
Figure 4 Mean PIF, weekly PIF range and variance (SE) in the overall population by study week.
Notes: Baseline PIF was measured in the clinic at first visit. Numbers in parentheses represent SE for both mean PIF and PIF range. At-home PIF measurements over respective weeks for each patient were used in the calculation of weekly PIF mean and range (difference between the highest and lowest PIF values). Data from Mahler et al.Citation19
Abbreviations: BL, baseline; PIF, peak inspiratory flow; SE, standard error.
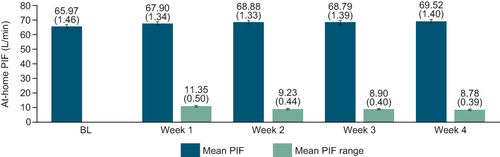
Table 2 Trend Analysis for Baseline Characteristics Across the PIF Subcategories
Figure 5 Correlation of PIF recorded at medium-low and high resistance.
Notes: Figure created using locally estimated scatterplot smoothing. Data from Drummond et al.Citation21
Abbreviation: PIF, peak inspiratory flow.
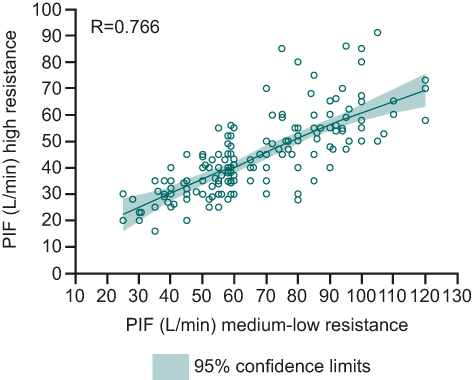
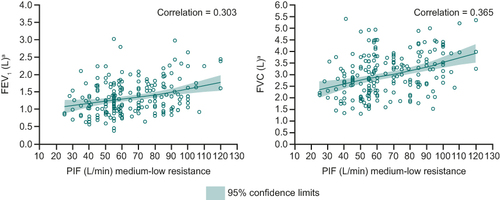
Figure 6 Correlation of PIF with FVC and FEV1.
Notes: aPost-bronchodilator. Figure created using locally estimated scatterplot smoothing. Data from Drummond et al.Citation21
Abbreviations: FEV1, forced expiratory volume in 1 second; FVC, forced vital capacity; PIF, peak inspiratory flow.