Figures & data
Figure 1 Flow chart of patient attrition.
Abbreviations: CB, chronic bronchitis; COPD, chronic obstructive pulmonary disease; ED, emergency department; INP, inpatient hospitalization; OV, physician office visit; SABA, short-acting β2-agonist; SAMA, short-acting muscarinic antagonist.
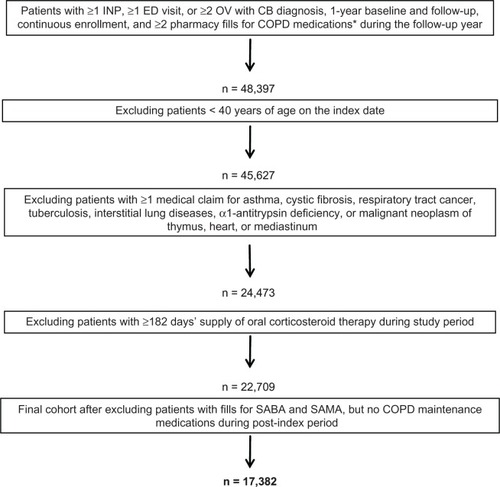
Table 1 Patient characteristics during the baseline year
Figure 2 Distribution of study population by COPD medication class on index date among overall patients.
Abbreviations: COPD, chronic obstructive pulmonary disease; ICS, inhaled corticosteroid; LABA, long-acting β2-agonist; LAMA, long-acting muscarinic antagonist; SABA, short-acting β2-agonist; SAMA, short-acting muscarinic antagonist.
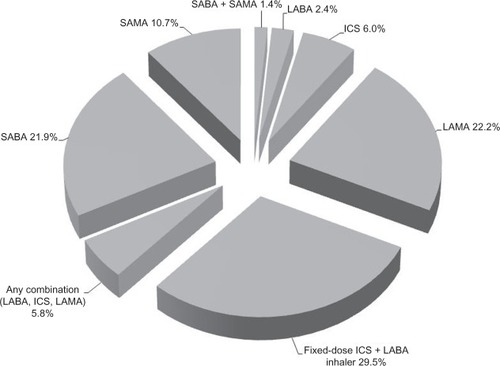
Figure 3 Mean ± SD number of fills for COPD medications (maintenance and rescue) during the follow-up year among overall patients.
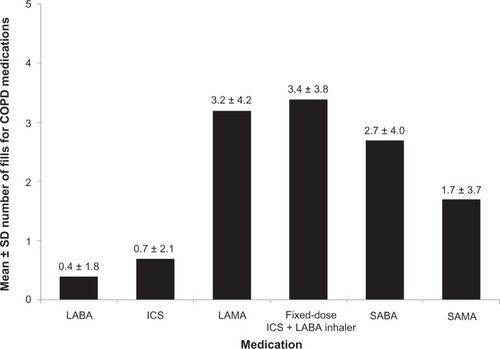
Table 2 Annual exacerbation numbers and total costs during the follow-up yearTable Footnote*
Figure 4 Exacerbations during the follow-up year among overall patients.
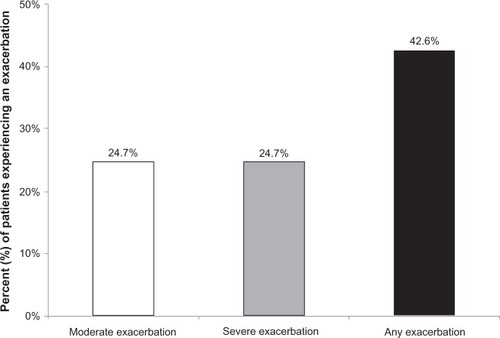
Table 3 Poisson regression results for the number of exacerbations (any type) during the follow-up year (n = 17,382)Table Footnote*
Figure 5 Mean ± SD cost per exacerbation during the follow-up year among overall patients.
Abbreviation: SD, standard deviation.
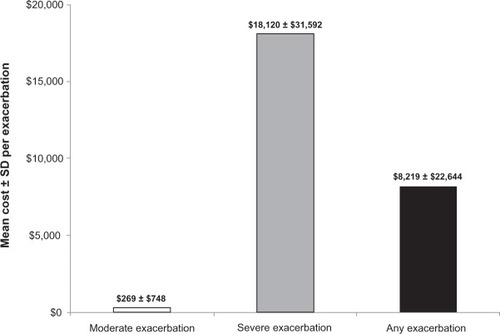
Table 4 Generalized linear model regression results for the cost of exacerbations (any type) during the follow-up year (n = 17,382)Table Footnote*