
Figures & data
Table 1 Clinical Characteristics of the Subjects
Table 2 Primers Used in the Study
Figure 1 Increased M2 macrophage polarization in COPD patients. Con-NS, nonsmokers without COPD; Con-S, smokers without COPD; COPD, COPD patients. (A) Lung macrophages were observed by immunofluorescence analysis in the Con-NS (n=5), Con-S (n=4), and COPD (n=3) groups. Scale bars, 50 µm. CD68: green; iNOS: red; CD206: red. (B) Immunofluorescence analysis of the total number of AMs. (C) Quantification of the percentages of M2 and M1 macrophages among total macrophages. Total macrophages: CD68+. M1%: iNOS+/CD68+. M2%: CD206+/CD68+. (D) Western blots. (E) Relative protein levels of MMP9 and MMP12 in the lung. The data are the mean ± SD (n=5). **P < 0.01.
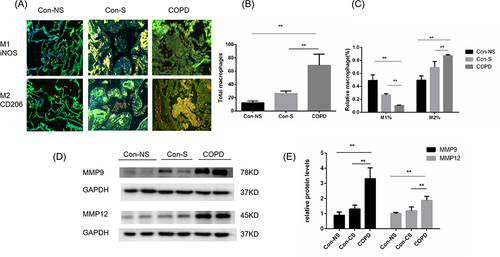
Figure 2 Emphysema and increased M2 macrophages in CS-exposed mice. Male C57BL/6J mice (6–8 weeks of age) were exposed to CS for 24 weeks. (A) Pulmonary function is shown as Penh in air-exposed mice and CS-exposed mice (n=6). (B) H&E staining of lung sections (scale bars, 100 µm) and (C) quantification of the MLI. (D) Lung macrophages in air-exposed mice (n=4) and CS-exposed mice (n=5) were observed by immunofluorescence analysis (scale bars, 100 µm). (E) Immunofluorescence analysis of the total number of macrophages and (F) quantification of the percentages of M2 and M1 macrophages among total macrophages in mouse sections. Total macrophages: F4/80+. M1%: iNOS+/F4/80+. M2%: CD206+/F4/80+. (G) The mRNA levels of M2 macrophage markers (Arg1 and Tgf-β1) and M1 macrophage markers (iNOS and TNF-α) were measured by quantitative RT–PCR. (H) Western blotting was performed, and (I) the relative protein levels of MMP9 and MMP12 were determined. The data are the mean ± SD (n=4). *P<0.05; **P < 0.01.
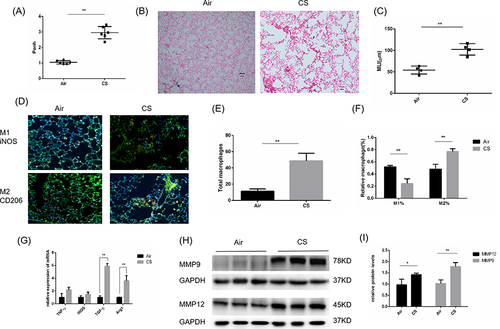
Figure 3 CHBE induced polarization of M2 type macrophages and expression of let-7c. (A) Scheme illustrating co culture experimental set-up. (B) The mRNA levels of macrophage markers in macrophages that were cocultured with CHBE cells were measured by quantitative RT–PCR.(C) Flow cytometry was performed, and (D) the M2/M1 ratio in the coculture cell model was determined. (E and F) Let-7 expression in human lung tissues (n=4) and serum (n=6). (G) Let-7 expression in the lung tissues of mice (n=4). (H) The mRNA levels of macrophage markers in HBE cells stimulated with 5% CSE for 0, 12, 24 and 48 h were measured. The data are the mean ± SD. *P<0.05; **P < 0.01.
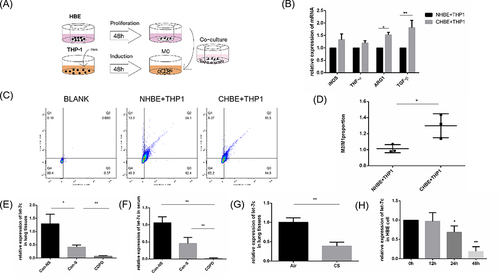
Figure 4 The release of IL-6 was stimulated by CSE and regulated by let-7c. NC, HBE cells treated with the NC mimic for 48 h. Let-7c, HBE cells treated with the let-7c mimic for 48 h. (A) IL-6 derived from 2% and 5% CSE-treated HBE cells induced for different times and measured by ELISA. (B) Relative mRNA expression of IL-6 in 5% CSE-treated HBE cells. (C) ELISA was performed to determine the relative release of IL-6 by HBE cells. (D) Schematic showing the putative let-7c target sites in the 3’UTR of IL-6 and the sequences of the mutant UTRs. (E) A luciferase reporter assay was performed after cotransfection with the let-7c mimic or NC mimic and IL-6-wt mimic or IL-6-mut mimic. The data are the mean ± SD (n=3). *P<0.05; **P < 0.01.
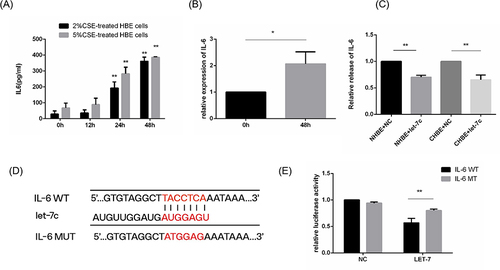
Figure 5 IL-6 induced STAT3 phosphorylation in M2 macrophages in vitro. CHBE, HBE cells that were treated with 5% CSE for 48 h; CHBE+tocilizumab, HBE cells that were pretreated with tocilizumab (4 µg/mL) for one hour and then treated with 5% CSE for 48 h. THP-1 cells were cocultured with HBE, CHBE and CHBE+tocilizumab cells for 48 h. Band densities were quantified by ImageJ software. GAPDH levels were measured in parallel and served as controls. (A) Western blotting was performed, and (B) the relative protein levels of STAT3 and p-STAT3 were determined. (C) The mRNA levels of M1 and M2 macrophage markers were measured by quantitative RT–PCR. (D) Quantification of the proportions of M2/M1 macrophages was assessed by flow cytometry. (E) Western blotting was performed, and (F) the relative protein levels of MMP9 and MMP12 were determined. The data are the mean ± SD. *P<0.05; **P < 0.01.
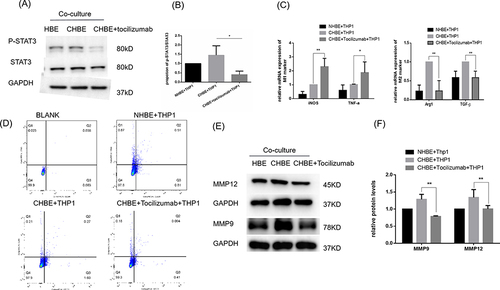
Figure 6 MicroRNA let-7 inhibits M2 macrophage polarization through the IL-6/STAT3 pathway. (A) PCR was performed to measure the transfection efficiency of the let-7c mimics. (B) Western blotting was performed, and (C) the relative protein levels of STAT3 and p-STAT3 were determined. (D) Flow cytometry was performed, and (E) the ratio of M2/M1 in the coculture cell model was determined. (F) The mRNA levels of M1 and M2 macrophage markers were measured by quantitative RT–PCR. (G) Western blotting was performed, and (H) the relative protein levels of MMP9 and MMP12 were determined. The data are the mean ± SD. *P<0.05; **P < 0.01.
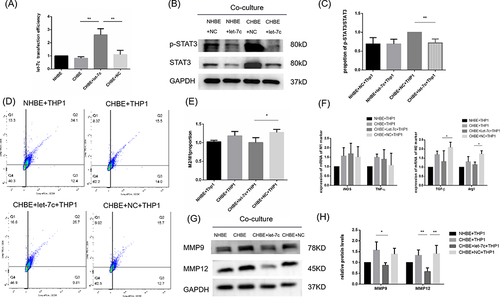
Figure 7 The mRNA levels of macrophage markers were measured in macrophages co-cultured with CHBE for 0.12.24.48 h by quantitative RT–PCR. The data are the mean ± SD. *P<0.05; **P < 0.01.
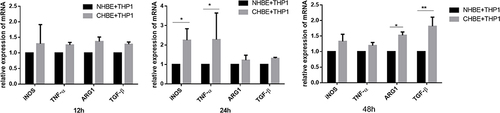
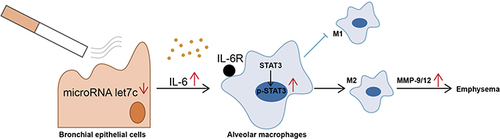
Figure 8 Schematic representation of the potential role of let-7c in COPD emphysema. Let-7c is negatively regulated in CHBE, promoting more releasable IL-6 to bind to IL-6R on the surface of alveolar macrophages, which induces phosphorylation of STAT3 in alveolar macrophages and polarization of M2 macrophages. M2 macrophages release more MMPs, leading to COPD emphysema.
Data Sharing Statement
All data generated or analyzed during this study are included in this published article.