Figures & data
Figure 1 Schematic representation of data collection.
Notes: Turquoise and purple colours represent retrospective and prospective data collection, respectively.
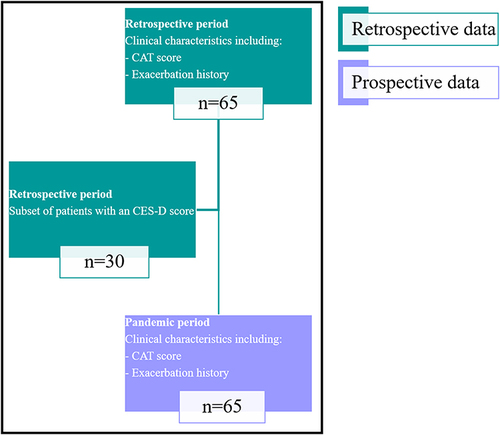
Table 1 Baseline Characteristics for COPD Patients (n = 65)
Figure 2 Association between baseline CES-D score and total CAT scores taken from baseline (A) and during the pandemic period (B).
Notes: Data represents individual patients at baseline (A) and during the pandemic (B), n = 30 and 27, respectively.
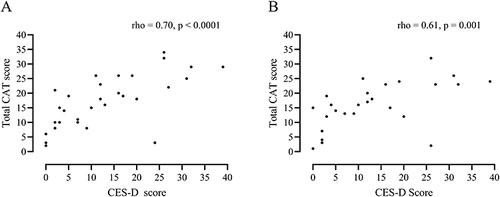
Figure 3 Total CAT scores for CES-D positive and negative groups (positive defined as a score ≥ 16).
Notes: March 23rd 2019-March 23rd 2020 (Baseline) n = 9 (▲); 12 (●), May 2020 (1) n = 12 (▲); 18 (●), July 2020 (2) n = 12 (▲), 17 (●); September 2020 (3) n = 12 (▲); 18 (●), November 2020 (4) n = 12 (▲); 17 (●), January 2021 (5) n = 10 (▲), 18 (●); March 2021 (6) n = 10 (▲), 17 (●). Data shown are mean values with one-way error bars representing the 95% confidence interval. *, **p < 0.05 and <0.01, respectively, for comparisons between CES-D positive and negative groups.
Abbreviations: CAT, COPD assessment test; CES-D, Center for epidemiologic studies depression scale; ▲, CES-D positive and ●, CES-D negative.
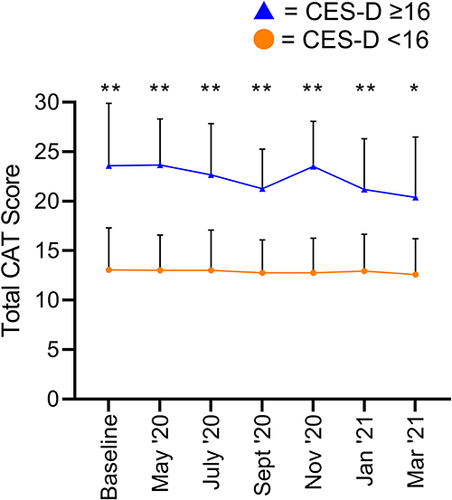
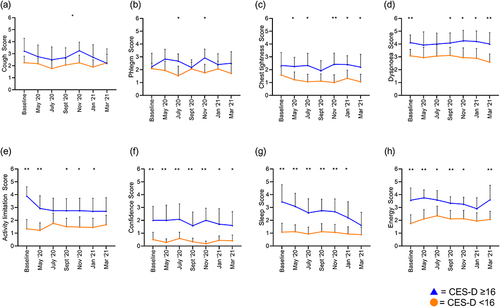
Figure 4 Individual CAT item scores for CES-D positive and negative groups (positive defined as a score ≥ 16); cough (a), phlegm (b), chest tightness (c), breathlessness going up hills/stairs (d), activity limitation at home (e), confidence leaving the home (f), sleep (g) and energy (h).
Notes: March 23rd 2019-March 23rd 2020 (Baseline) n = 9 (▲); 12 (●), May 2020 (1) n = 12 (▲); 18 (●), July 2020 (2) n = 12 (▲), 17 (●); September 2020 (3) n = 12 (▲); 18 (●), November 2020 (4) n = 12 (▲); 17 (●), January 2021 (5) n = 10 (▲), 18 (●); March 2021 (6) n = 10 (▲), 17 (●). Data shown are mean values with one-way error bars representing the 95% confidence interval. *, **p < 0.05 and <0.01, respectively, for comparisons between CES-D positive and negative groups.
Abbreviations: CAT, COPD assessment test; CES-D, Center for epidemiologic studies depression scale; ▲, CES-D positive and ●, CES-D negative.