Figures & data
Figure 1 Study design.
Abbreviations: BDP, beclomethasone dipropionate; BUD, budesonide; ICS, inhaled corticosteroid; FOR, formoterol fumarate; FP, fluticasone propionate; LABA, long-actingβ2-agonist; SX, salmeterol xinafoate; UMEC, umeclidinium; VI, vilanterol.
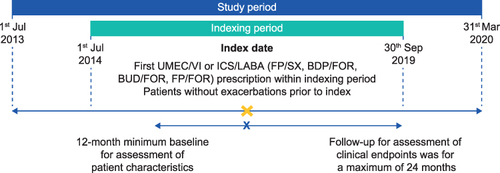
Table 1 Patient Demographics and Clinical Characteristics
Figure 2 (A) Proportion of patients and (B) odds of adherence (PDC≥80%) at 12 months post-index.
Abbreviations: ATE, average treatment effect; CI, confidence interval; ICS, inhaled corticosteroid; LABA, long-actingβ2-agonist; PCD, proportion of days covered; UMEC, umeclidinium; VI, vilanterol.
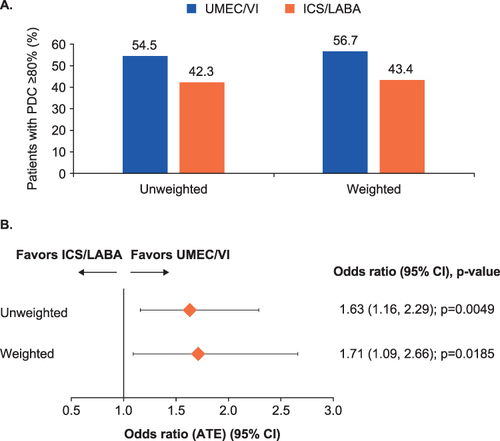
Figure 3 Odds of adherence (PDC≥80%) at 6, 18, and 24 months post-index.
Abbreviations: ATE, average treatment effect; CI, confidence interval; ICS, inhaled corticosteroid; LABA, long-actingβ2-agonist; PCD, proportion of days covered; UMEC, umeclidinium; VI, vilanterol.
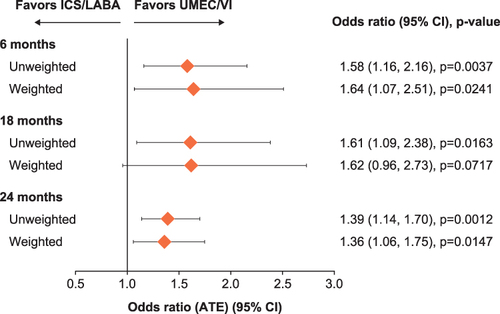
Figure 4 (A) Time-to-first triple therapy and (B) time-to-first moderate-to-severe COPD exacerbation.
Abbreviations: ATE, average treatment effect; CI, confidence interval; ICS, inhaled corticosteroid; LABA, long-actingβ2-agonist; UMEC, umeclidinium; VI, vilanterol.
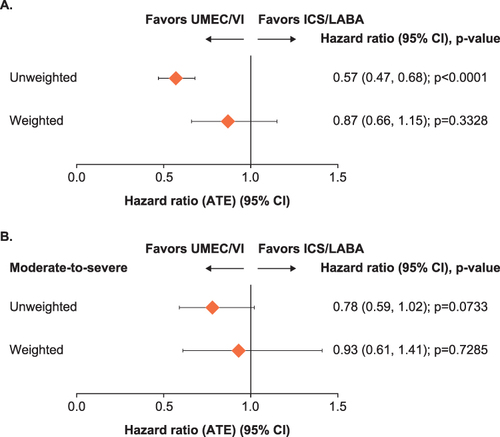
Figure 5 Rate ratio of (A) COPD-related and (B) all-cause HCRU use at 12 months post-index.
Abbreviations: A&E, Accident and Emergency; ATE, average treatment effect; CI, confidence interval; COPD, chronic obstructive pulmonary disease; GP, general practitioner; HCRU, healthcare resource utilization; ICS, inhaled corticosteroid; LABA, long-actingβ2-agonist; UMEC, umeclidinium; VI, vilanterol.
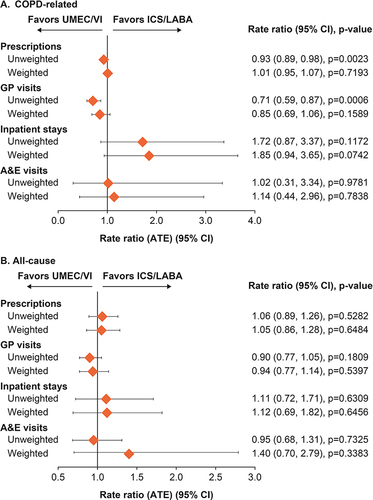
Figure 6 (A) COPD-related and (B) all-cause direct healthcare costs at 12 months post-index.
Abbreviations: ATE, average treatment effect; A&E, Accident and Emergency; CI, confidence interval; COPD, chronic obstructive pulmonary disease; GP, general practitioner; HCRU, healthcare resource utilization; ICS, inhaled corticosteroid; LABA, long-actingβ2-agonist; UMEC, umeclidinium; VI, vilanterol.
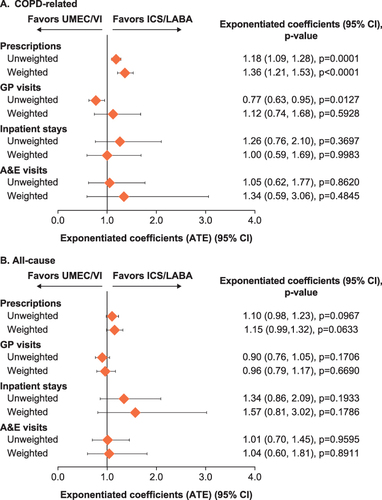
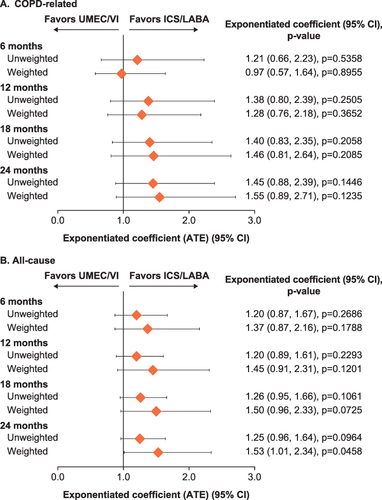
Figure 7 (A) COPD-related and (B) all-cause and total costs at 6, 12, 18, and 24 months post-index.
Abbreviations: ATE, average treatment effect; CI, confidence interval; COPD, chronic obstructive pulmonary disease; HCRU, healthcare resource utilization; ICS, inhaled corticosteroid; LABA, long-actingβ2-agonist; UMEC, umeclidinium; VI, vilanterol.