326
Views
2
CrossRef citations to date
0
Altmetric
ORIGINAL RESEARCH

A Novel Metabolic Score for Predicting the Acute Exacerbation in Patients with Chronic Obstructive Pulmonary Disease

ORCID Icon, , , , , & ORCID Icon show all
Pages 785-795 | Received 20 Jan 2023, Accepted 30 Apr 2023, Published online: 05 May 2023

Figures & data

Figure 1 Metabolomics-based serum metabolite screening workflow.

Figure 1 Metabolomics-based serum metabolite screening workflow.

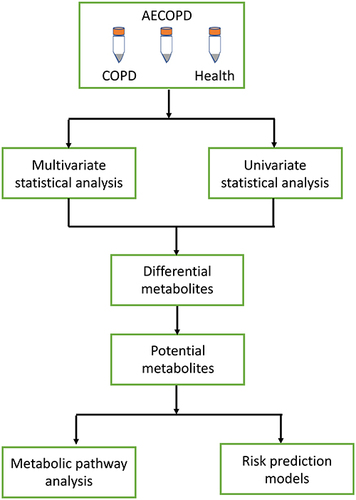
Table 1 Clinical Characteristics of Patients with COPD and Control Population in the Study

Table 2 A Multivariable Logistic Regression Analysis on the Acute Exacerbation of COPD

Figure 2 (A) Heatmap of metabolite levels in COPD patients including AECOPD and COPD compared to control population. (B) Different metabolites among AECOPD, COPD and controls. (C) Compared with healthy controls, 12 metabolic pathways were significantly altered in COPD patients. (D) Compared with the stable COPD, 8 metabolic pathways were significantly altered in AECOPD patients. (E and F) Enrichment analysis on these differential metabolites showed they can also be expectedly enriched in energy metabolism and nucleotide metabolism. (G) The metabolite-pathway network was constructed using Gephi software.

Figure 2 (A) Heatmap of metabolite levels in COPD patients including AECOPD and COPD compared to control population. (B) Different metabolites among AECOPD, COPD and controls. (C) Compared with healthy controls, 12 metabolic pathways were significantly altered in COPD patients. (D) Compared with the stable COPD, 8 metabolic pathways were significantly altered in AECOPD patients. (E and F) Enrichment analysis on these differential metabolites showed they can also be expectedly enriched in energy metabolism and nucleotide metabolism. (G) The metabolite-pathway network was constructed using Gephi software.

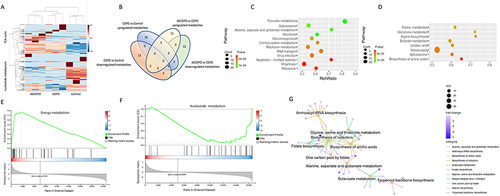
Table 3 Analysis for the Association Between M-Score and Characteristics of Patients with COPD

Figure 3 (AD) The levels of pyruvate, isoleucine, 1-methylhistidine and glutamine between AECOPD and COPD were quantitatively compared. (E) The related level index among the four metabolites were calculated and a metabolite score based on the related level index was constructed through applying a weighted sum of concentrations of 4 metabolites. (F) The correlation between stable COPD and AECOPD patients with pulmonary ventilation function and symptoms was analyzed by using a Pearson correlation coefficient.

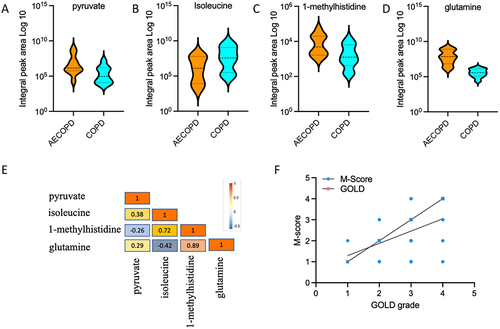
Figure 3 (A–D) The levels of pyruvate, isoleucine, 1-methylhistidine and glutamine between AECOPD and COPD were quantitatively compared. (E) The related level index among the four metabolites were calculated and a metabolite score based on the related level index was constructed through applying a weighted sum of concentrations of 4 metabolites. (F) The correlation between stable COPD and AECOPD patients with pulmonary ventilation function and symptoms was analyzed by using a Pearson correlation coefficient.