Figures & data
Figure 1 The percentage of three DPM parameters for the five imaging clusters in 131 subjects. Bars show the percentage of DPMNormal (green), DPMGasTrap (yellow), and DPMEmph (red). The number of subjects comprised 32, 20, 33, 32, and 14 in the NL, NL-GT, GT, GT-EM, and EM clusters, respectively.
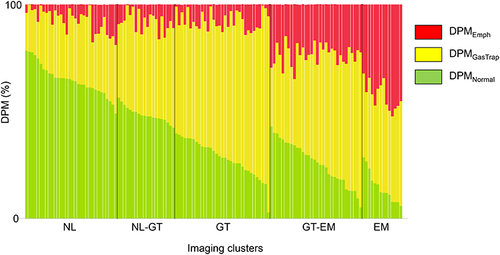
Table 1 Characteristics of the Five Imaging Clusters
Table 2 Pulmonary Functions and FeNO Among the Five Imaging Clusters
Table 3 FOT Parameters Among the Five Imaging Clusters
Figure 2 Comparison of computed tomography imaging biomarkers among the imaging clusters. Box plot of (a) LAV% and (b) √Aaw at Pi10 according to imaging clusters. The x mark shows the mean value. The Wilcoxon rank-sum test was used to compare computed tomography imaging biomarkers among clusters. *p < 0.05 compared with NL; †p < 0.05 compared with NL-GT; ⁑p < 0.05 compared with GT; ‡p < 0.05 compared with GT-EM.
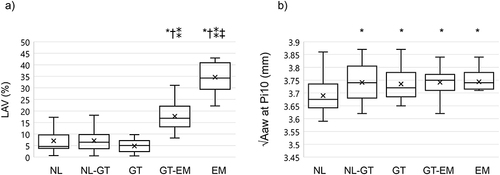
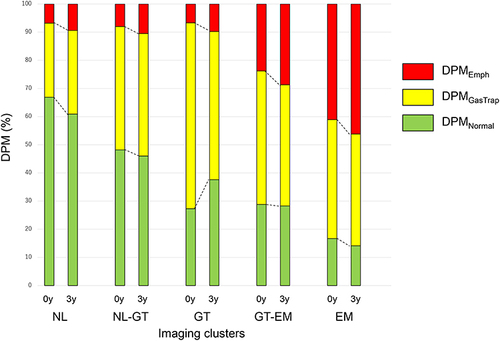
Figure 3 Longitudinal changes in DPM parameters of the imaging clusters. The baseline data and the 3-year follow-up data of 84 subjects are shown side-by-side. Bars show the mean percentage data of DPMNormal (green), DPMGasTrap (yellow), and DPMEmph (red). The number of subjects comprised 19, 14, 23, 20, and 8 in the NL, NL-GT, GT, GT-EM, and EM clusters, respectively.