Figures & data
Figure 1 Chronic hypoxia (CH) promotes the apoptosis and migration of human pulmonary artery endothelial cells (HPAECs). (A). The apoptosis of CH-induced HPAECs was measured using flow cytometry. (B). JC-1 was used to determine the mitochondrial membrane potential. (C). Scratch-wound assay to assess cell migration. (D). Quantification (percentage) of apoptotic cells (****P<0.0001). (E). Quantification of mitochondrial membrane potential (**P<0.01). (F). Quantification of cell migration (***P<0.001). (G). MTT assay to assess the proliferative capacity of HPAECs.
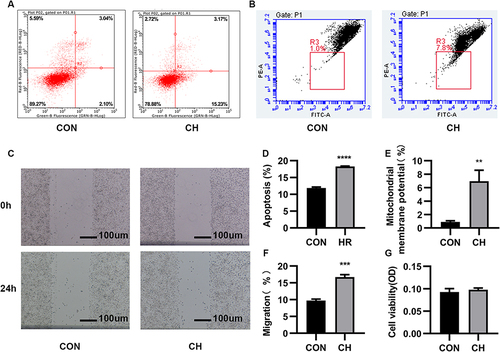
Figure 2 Autophagy is activated in HPAECs subjected to CH. (A). Immunofluorescence staining was used to examine the relative fluorescence intensity and levels of LC3 in HPAECs. (B). Expression of LC3 and P62 proteins in HPAECs as determined by Western blotting. (C). Semi-quantification of LC3-II/LC3-I protein expression (***P<0.001). (D). Semi-quantification of P62 protein expression (***P<0.001). E. Electron micrographs showing the formation of autophagic vacuoles in HPAECs. a. Electron microscopy of HPAECs in control group (×2.0k). b. Electron microscopy of HPAECs in control group (×7.0k). c. Electron microscopy of chronic hypoxia-induced HPAECs (×2.0k). d. Electron microscopy of chronic hypoxia-induced HPAECs (×7.0k).
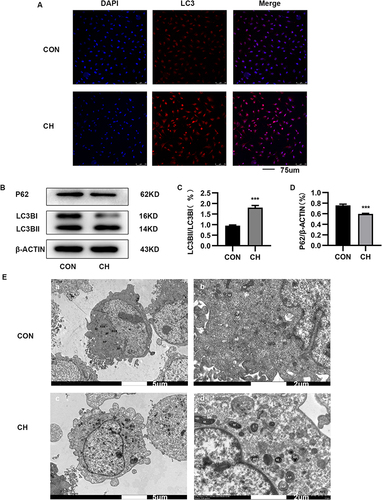
Figure 3 3-Methyladenine (3-MA) inhibits autophagy and promotes apoptosis. (A and B) Apoptosis of HPAECs subjected to CH after inhibition of autophagy using 3-MA, as measured using flow cytometry. (C) Expression of LC3 and P62 proteins in HPAECs, as determined by Western blotting. (D and E) Quantification of the expression of LC3B and P62 in HPAECs (****P<0.0001).
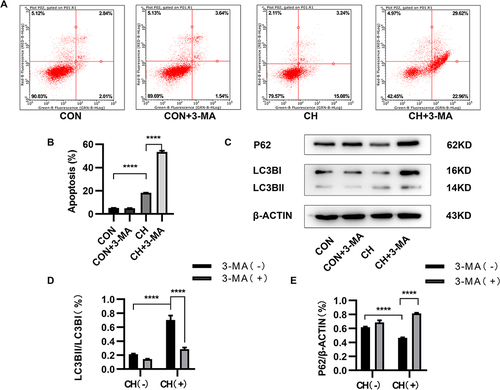
Figure 4 Identification of differentially expressed genes (DEGs) in the CH and CON groups using gene expression profiling chips. (A) Volcano plot of CH and CON groups. (B) Heatmap of DEG expression. (C) Heatmap of expression of 20 hub genes. PIF1* (the gene we studied).
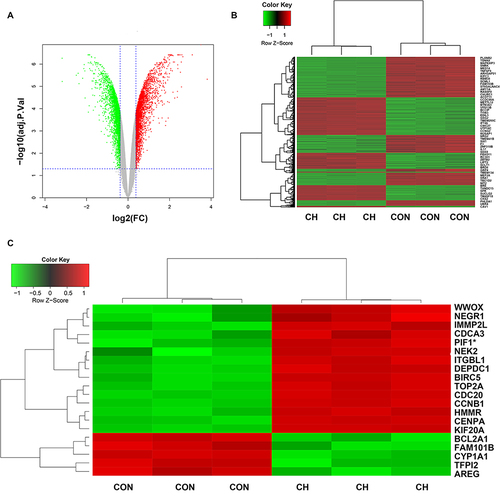
Figure 5 Gene Ontology (GO) and Kyoto Encyclopedia of Genes and Genomes (KEGG) analysis of DEGs. (A) GO term enrichment analysis for biological process, molecular function, and cellular component. (B and C) KEGG pathway analysis. Node size represents the gene ratio; node color indicates P-value.
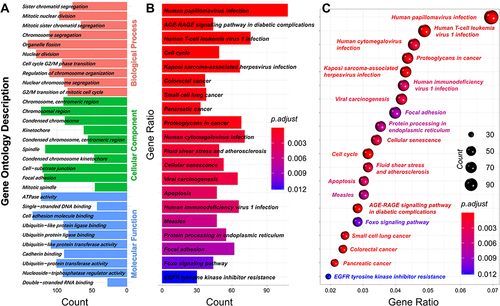
Figure 6 Effect of PIF1 knockdown on autophagy in HPAECs. (A) Expression of PIF1 mRNA (****P<0.0001). (B) Expression of PIF1 in HPAECs, as measured by Western blotting. (C) Quantification of the expression of PIF1 protein in HPAECs (****P<0.0001). (D–F) Validation of PIF1 knockdown efficiency (*P < 0.05, ****P<0.0001). (G) Expression of PIF1, and P62 in HPAECs, as measured by Western blotting. (H) Expression of LC3 protein in HPAECs, as measured by Western blotting. (I) HPAECs were transfected with shPIF1 and then, treated with 20 μg/mL of leupeptin for 24 h. Cell lysates were prepared for Western blotting analysis of LC3 and β-ACTIN. (J–M) Quantification of the expression of PIF1, P62, and LC3B in HPAECs (*P < 0.05, **P<0.01, ***P<0.001, ****P<0.0001). (N) Electron micrographs showing the formation of autophagic vacuoles in HPAECs. a. Electron microscopy of HPAEC in negative control (NC) group under CH conditions (×3.0k). b–c. Electron microscopy HPAEC subjected to CH after PIF1 knockdown (×3.0k). d. Electron microscopy of HPAEC in negative control group under CH conditions (×7.0k). e–f. Electron microscopy HPAEC subjected to CH after PIF1 knockdown (×7.0k).
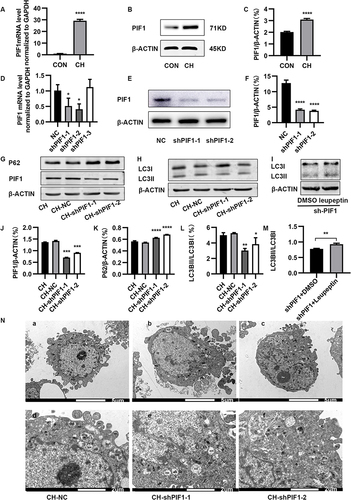
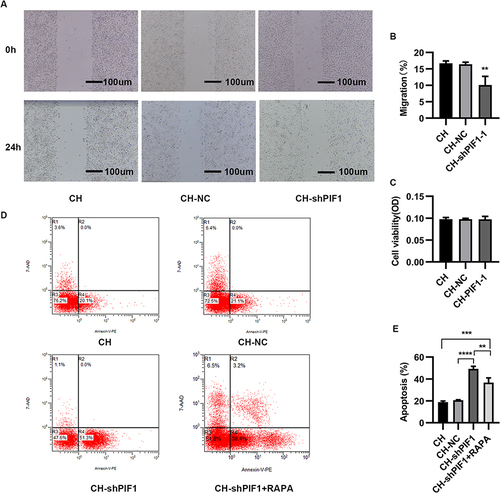
Figure 7 Migration, proliferation, and apoptosis of HPAECs subjected to CH after PIF1 knockdown. (A) Scratch-wound assay to assess migration of HPAECs subjected to CH after PIF1 knockdown. (B) Quantification of migration (**P<0.01). (C) Proliferation of HPAECs subjected to CH after PIF1 knockdown. (D) Apoptosis of HPAECs after PIF1 knockdown and of cells treated with rapamycin (RAPA) along with knockdown of PIF-1, as measured using flow cytometry. (E) Quantification (percentage) of apoptotic HPAECs (**P<0.01, ***P<0.001, ****P<0.0001).