
Figures & data
Figure 1 Total monthly number of hospital admissions due to COVID-19 at Sahlgrenska University Hospital throughout the pandemic (regardless of COPD diagnosis). Five separate waves of COVID-19 admission were identified.
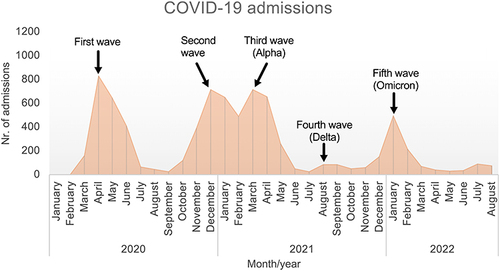
Figure 2 Linear graphs showing the three-month moving average number of hospital admissions according to primary diagnosis (acute exacerbations, pneumonia, influenza, or COVID-19) in patients with chronic obstructive pulmonary disease, during the prepandemic, pandemic, and post-restriction periods. A combined outcome including all of the primary diagnoses above is also shown (total COPD admissions, dashed line).
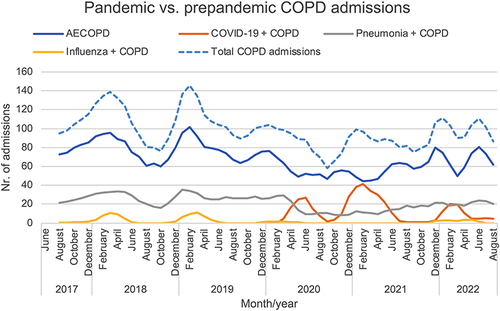
Table 1 Average Monthly Admission Rates in COPD Patients According to Primary Diagnosis During the Pandemic, Compared with a Prepandemic Period
Figure 3 Hospital admission incidence rate ratios for (a) acute exacerbations of chronic obstructive pulmonary disease and (b) pneumonia, from January 2020 through August 2022. An incidence rate ratio below 1.0 indicates a decrease in the rate of hospital admissions during the pandemic, compared with the prepandemic period. The incidence rate ratios for the combined outcome of total COPD admissions (acute exacerbations, pneumonia, influenza, or COVID-19) are also shown (dashed blue line). For reference, the total number of all registered COVID-19 admissions at the hospital is shown on the secondary y-axis (shaded Orange graph).
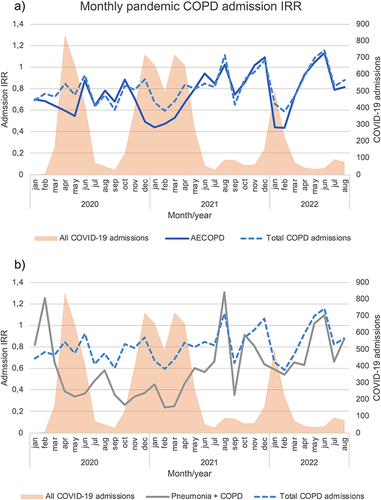
Table 2 Incidence Rate Ratios for Admissions of COPD Patients by Primary Diagnosis During the Different Waves of the Pandemic Compared with the Prepandemic Period