Figures & data
Table 1 Analysis of Prognostic Factors in Patients with Acute Exacerbated Chronic Obstructive Pulmonary Disease (AECOPD)
Table 2 Multivariate Logistic Analysis for Poor Prognosis in Patients with Acute Exacerbated Chronic Obstructive Pulmonary Disease (AECOPD)
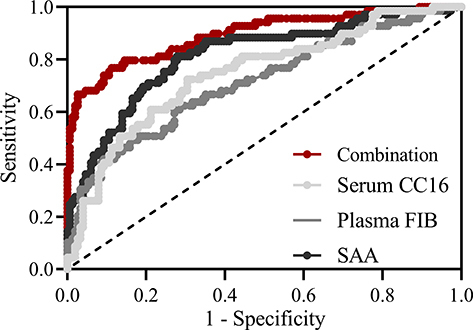
Table 3 Predictive Values in ROC Analysis
Figure 1 Comparisons of serum CC16 (A), plasma FIB (B) and SAA (C) at admission between AECOPD patients with good prognosis (n = 151) and poor prognosis (n = 69) in one year follow-up. P values were calculated from Mann–Whitney test. Spearman correlation analysis of serum CC16 with plasma FIB (D), serum CC16 with SAA (E), plasma FIB with SAA (F) in all the AECOPD patients (n = 220), p < 0.001 in three analyses.
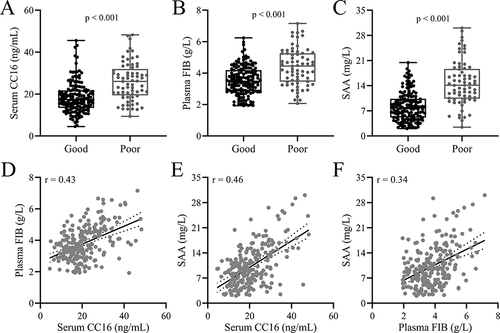
Figure 2 Correlation of serum CC16, plasma FIB and SAA with the severity of AECOPD. Comparisons of serum CC16 (A), plasma FIB (B) and SAA (C) at admission between AECOPD patients with GOLD class of I–II (n = 109) and III–IV (n = 111). P values were calculated from Mann–Whitney test. Spearman correlation analysis of PaCO2 with serum CC16 (D), plasma FIB (E) and SAA (F) in all the AECOPD patients (n = 220), p < 0.001 in three analyses.
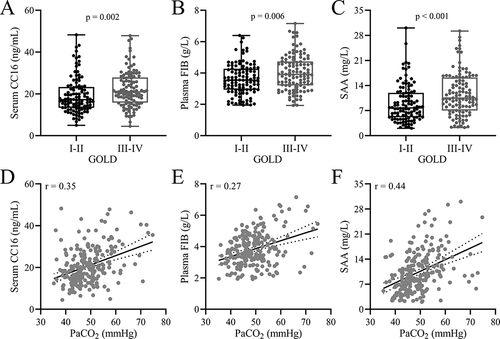
Figure 3 ROC analysis of predictive values of serum CC16, plasma FIB, SAA at admission and their combination test for the prognosis assessment of AECOPD in one year follow-up.