Figures & data
Figure 1 Flow chart of study selection and exclusion.
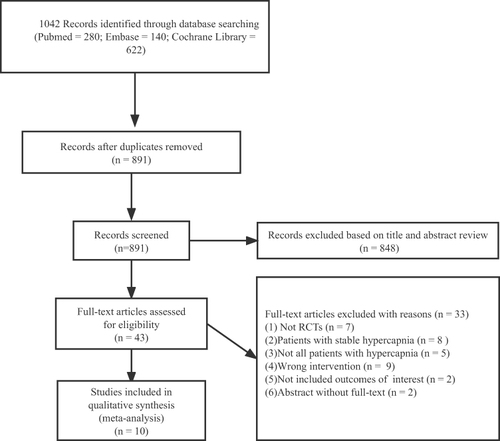
Table 1 The Characteristics of Included Studies
Figure 2 Results of risk assessment of bias using Cochrane risk of bias tool.
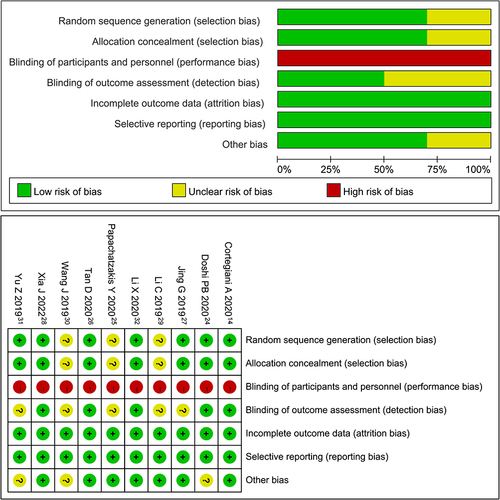
Figure 3 Forest plot comparing intubation rate between HFNC and control groups.
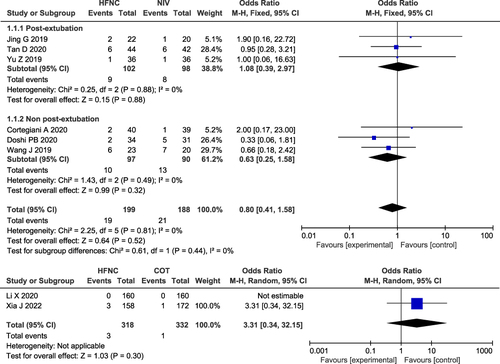
Figure 4 Forest plot comparing mortality between HFNC and control groups.
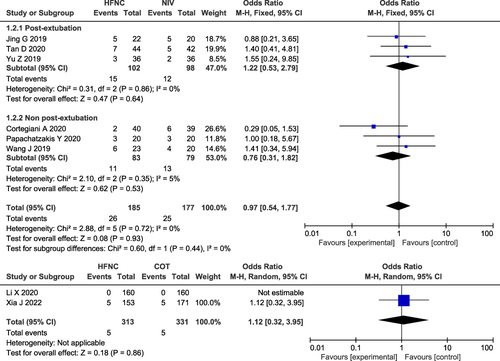
Figure 5 (a) Forest plot comparing treatment crossover rate between HFNC and NIV; (b) Forest plot comparing the need for NIV between HFNC and COT.
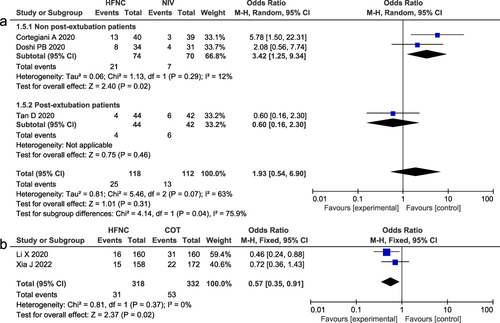
Figure 6 Forest plot comparing pH between HFNC and control groups.
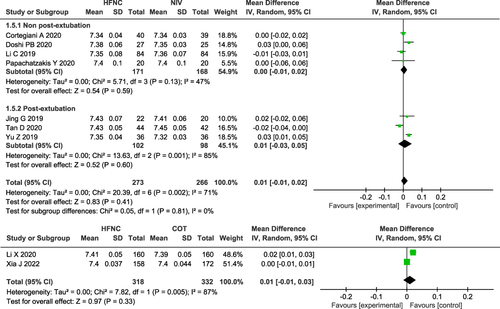
Figure 7 Forest plot comparing PaCO2 between HFNC and control groups.
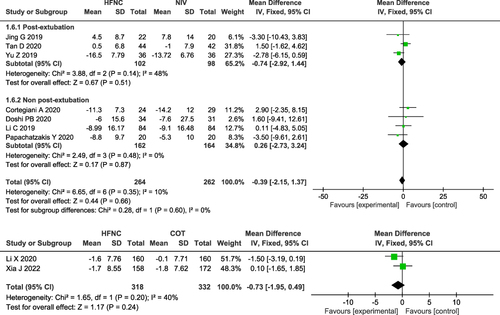
Figure 8 Forest plot comparing oxygenation between HFNC and control groups.
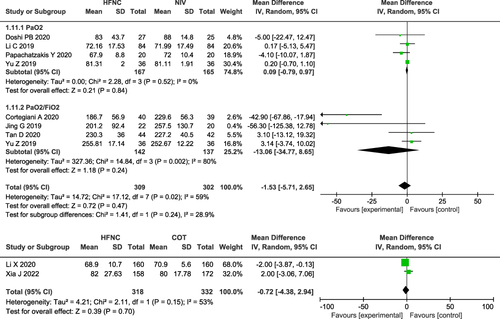
Figure 9 Forest plot comparing RR between HFNC and control groups.
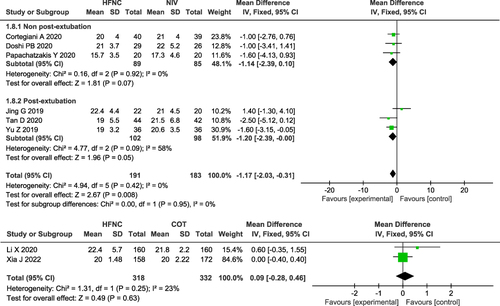
Figure 10 Forest plot comparing HR between HFNC and NIV.
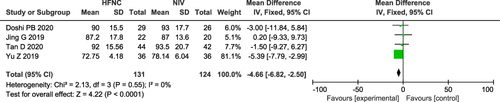
Figure 11 (a) Forest plot comparing hospital stay between HFNC and NIV; (b) Forest plot comparing ICU stay between HFNC and NIV; (c) Forest plot comparing hospital stay between HFNC and COT.
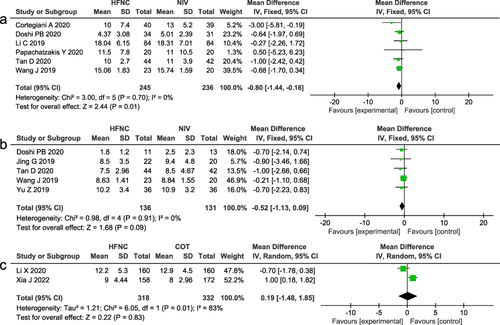
Figure 12 Forest plot comparing adverse events between HFNC and NIV.
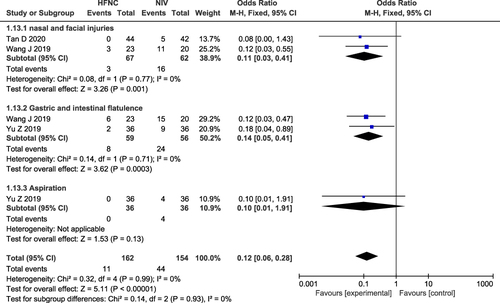
Figure 13 (a) Forest plot comparing comfort score between HFNC and NIV; (b) Forest plot comparing dyspnea score between HFNC and NIV.
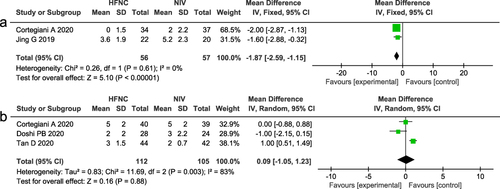
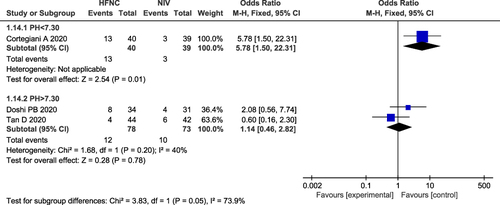
Figure 14 Forest plot and subgroup analyses comparing treatment crossover rate between pH<7.30 and pH>7.30.