Figures & data
Table 1 Characterstics of the Included Studies
Figure 1 Study selection process: PRISMA flow diagram identifying studies included in the meta-analysis.
Notes: PRISMA figure adapted from Page MJ, McKenzie JE, Bossuyt PM, et al. The PRISMA 2020 statement: an updated guideline for reporting systematic reviews. BMJ. 2021;372:n71. Creative Commons.Citation34
Abbreviation: PRISMA, Preferred reporting Items for systematic reviews and Meta-analyses.
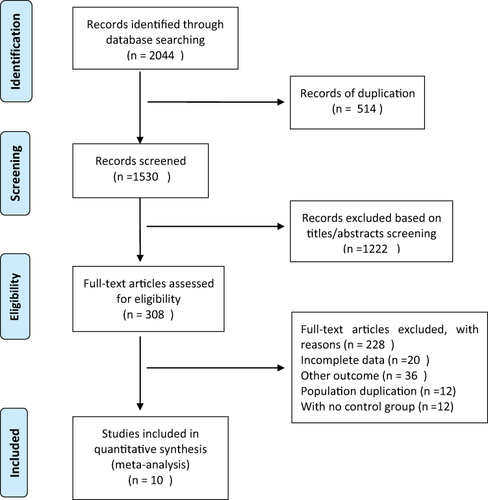
Figure 2 Forest plot of the serum IL-17 level between SCOPD and control patients.
Abbreviations: SCOPD, stable chronic obstructive pulmonary disease; AECOPD, acute exacerbation chronic obstructive pulmonary disease; SMD, standard mean difference.
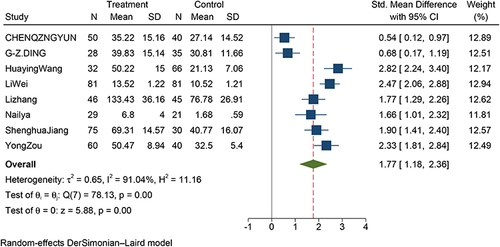
Figure 3 Forest plot of the serum IL-17 level between AECOPD and SCOPD patients.
Abbreviations: SCOPD, stable chronic obstructive pulmonary disease; AECOPD, acute exacerbation chronic obstructive pulmonary disease; SMD, standard mean difference.
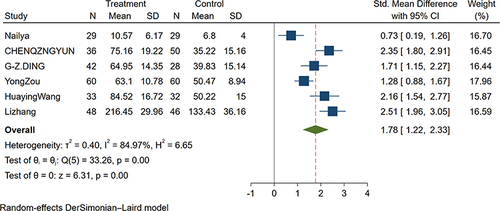
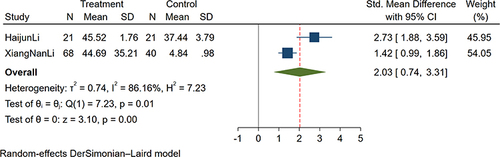
Figure 4 Forest plot of the sputum IL-17 level between COPD and control patients.
Abbreviations: SCOPD, stable chronic obstructive pulmonary disease; AECOPD, acute exacerbation chronic obstructive pulmonary disease; SMD, standard mean difference.