Figures & data
Table 1 Components of Bu-Fei Yi-Shen Granules
Figure 1 Study trial procedure.
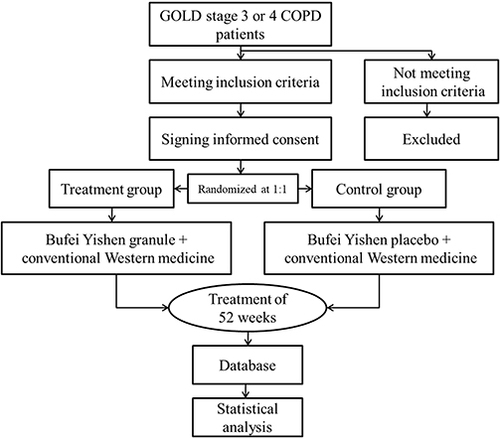
Figure 2 Procedures for each patient in the study.
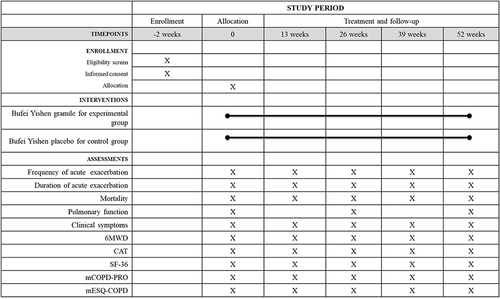
Table 2 Summary of Discontinuities/Dropouts/ Withdraw for the Two Groups
Table 3 Baseline Characteristics of Included COPD Patients§
Figure 3 Comparison of differences between groups regarding AEs.
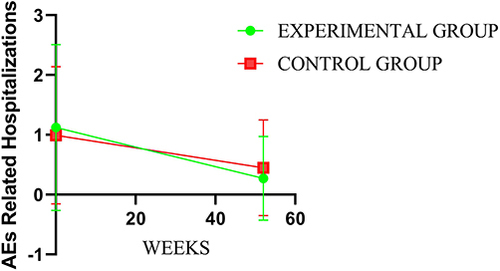
Figure 4 Comparison of differences between groups regarding pulmonary function. Pulmonary function, including FEV1, FVC, and FEV1%, were collected and evaluated. (A-C) represent intergroup differences in FEV1, FVC, and FEV1%, respectively. Lower values reflect worse pulmonary function.
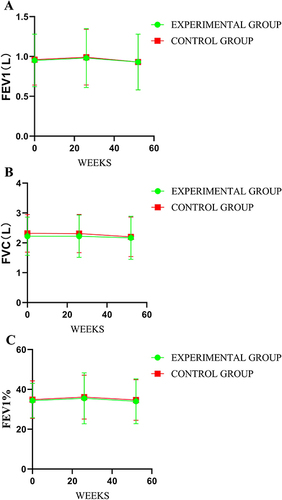
Figure 5 Comparison of differences between groups regarding signs and symptoms. Signs and symptoms, including cough, expectoration, wheezing, chest tightness, shortness of breath, fatigue, cyanosis scores, and total scores were calculated and compared between the groups (represented in A, B, C, D, E, F, G, and H, respectively). Lower scores reflect better signs and symptoms.
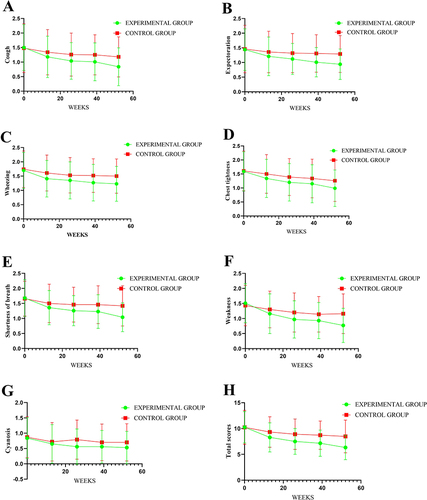
Figure 6 Comparison of differences between groups regarding 6MWD.
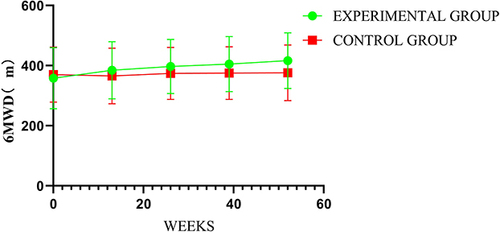
Figure 7 Comparison of differences between groups regarding CAT, mCOPD-PRO, and mESQ-COPD.
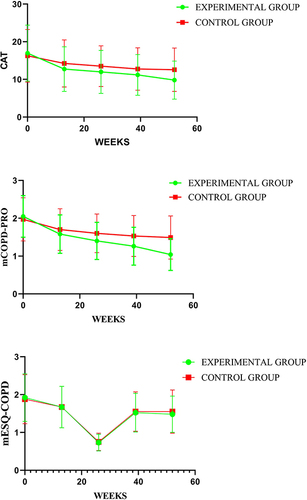
Figure 8 Comparison of differences between groups regarding SF-36.
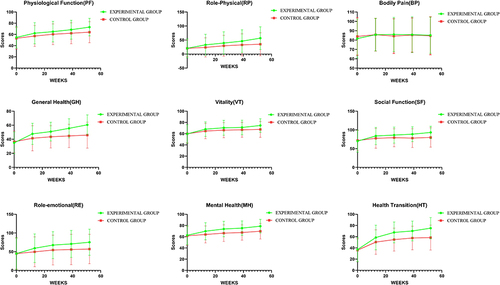
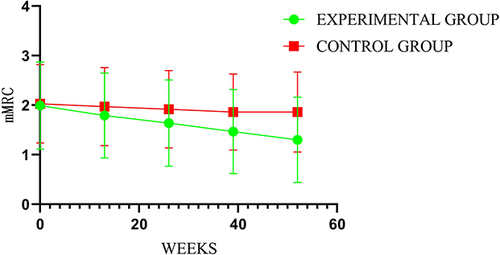
Figure 9 Comparison of differences between groups on mMRC.