Figures & data
Figure 1 Schematic representation of the project workflow.
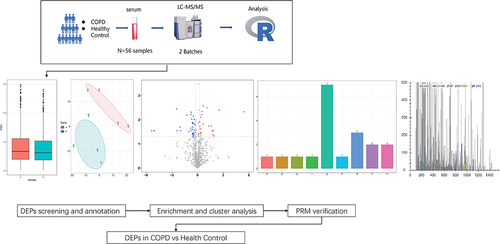
Table 1 Clinical Diagnoses and Demographic Characteristics of Participants
Figure 2 Process and quality control of DIA.
Notes: Sodium dodecyl sulphate-polyacrylamide gel electrophoresis (SDS-PAGE) after removal of highly abundant proteins and data quality control (A). Lanes A1-A4 show serum proteins from COPD group. Lanes B1-B4 show serum proteins from Healthy Control group. Lane M shows the marker. Results of identified peptides, identified proteins and quantifiable proteins (B). The horizontal axis is the peptides or proteins, and the vertical axis is the amount. Boxplot for relative standard deviation (RSD) of protein quantification from all repeated samples (C). The horizontal axis is the sample group, and the vertical axis is the RSD. Diagram of peptide length distribution (D). The horizontal axis is the peptide length, and the vertical axis is the number of peptides. Heat map for correlation coefficients within protein quantification for every two samples (E). This value measures the degree of linear correlation between two groups: the closer the Pearson correlation coefficient is close to −1, the correlation is negative; the closer it is to 1, the correlation is positive; the closer it is to 0, the correlation is not correlated.
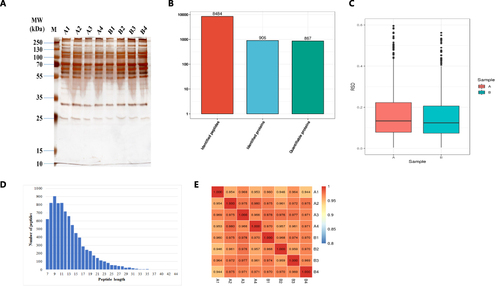
Figure 3 Results of differential expression proteins (DEPs) analysis.
Notes: Principal-component analysis (PCA) of samples from COPD (A1-A4) and Healthy Control group (B1-B4) (A). The higher degree of aggregation between the duplicated samples, the better the quantitative repeatability. Histogram of DEPs from COPD and Healthy control group (B). Volcano plots of DEPs from COPD and Healthy control group (C). The horizontal axis is the relative quantitative protein value after Log2 transformation, and the vertical axis is the P value of difference significance test after Log10 transformation. Heat map of DEPs from COPD and Healthy Control group (D). Each column indicates a sample and each row indicates a protein. The red colors represent up-regulated proteins and the blue colors represent down-regulated proteins. The color intensity represents the ratio of relative protein content from COPD to Healthy control group.
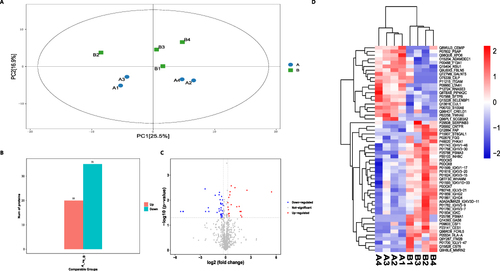
Figure 4 Gene Ontology (GO) functional annotation and Kyoto Encyclopedia of Genes and Genomes (KEGG) pathway functional enrichment of DEPs.
Notes: The biological process, cellular component and molecular functional annotation of DEPs (A). The horizontal axis is the GO terms name, and the vertical axis is the number of proteins. Cellular component annotation of DEPs (B). Clusters of Orthologous Groups of proteins (prokaryotic homologous protein clusters/eukaryotic homologous protein clusters, COG/KOG) functional classification annotation of DEPs (C). The horizontal axis is the COG/KOG categories, and the vertical axis is the frequency of matched COG/KOG. KEGG pathway enrichment annotation of DEPs (D). The horizontal axis is the rich factor, and the vertical axis is the pathway.
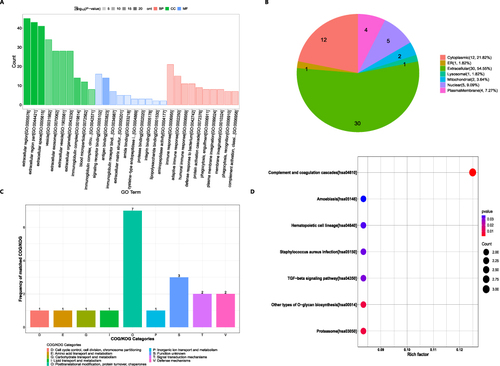
Figure 5 Protein–protein interaction (PPI) networks analysis of DEPs.
Note: Each node represents a protein and lines between the nodes represent the interaction between two proteins.
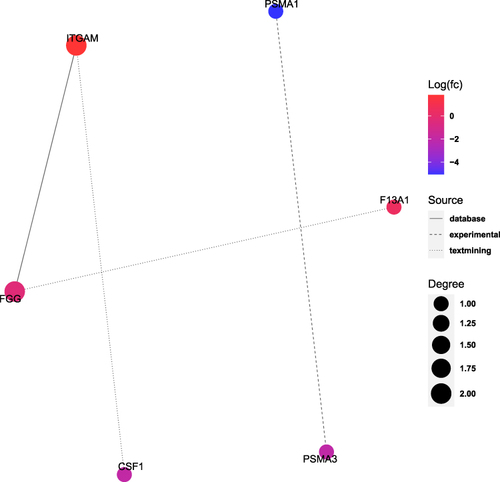
Table 2 Differential Expression Proteins in Serum Samples from COPD and Healthy Control Group
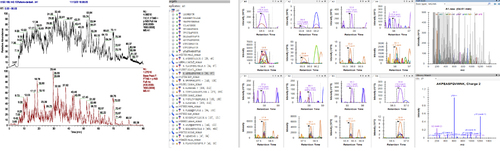
Figure 6 Chromatogram of quality control for parallel reaction monitoring (PRM) verification of DEPs.