Figures & data
Table 1 Demographic and Clinical Characteristics of the Two Groups
Figure 1 Detection of exosomes. (A) Western blot analysis detected the exosomal marker, CD63. (B) Representative TME image of an exosome. The structure of the exosome is cystic with a double membrane and a diameter of about 50 nm.
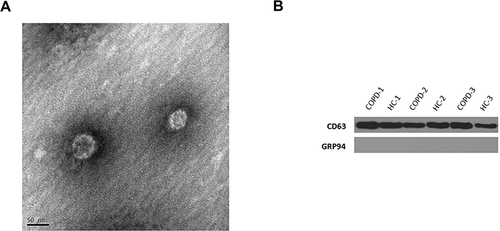
Figure 2 Differential expression of lncRNAs and mRNAs in plasma exosomes obtained from patients with sCOPD. (A and C) Volcano plots suggesting the differential expression of lncRNAs and mRNAs between sCOPD and normal control plasma samples. The red squares show the differentially expressed lncRNAs and mRNAs identified by sequencing. The vertical line marks the 2.0-fold (log2 scaled) upward or downward changes. The horizontal line marks the p-value of 0.05 (−log10 scaled). (B and D) Scatter plots distribution of lncRNAs and mRNAs.
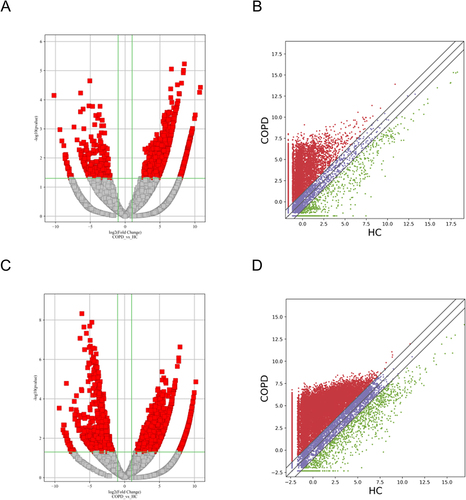
Figure 3 Gene ontology (GO) enrichment analysis. The horizontal axis represents the enrichment score. The vertical axis represents the GO terms. (A–C) GO analysis of the upregulated lncRNAs. (D–F) GO analysis of the downregulated lncRNAs.
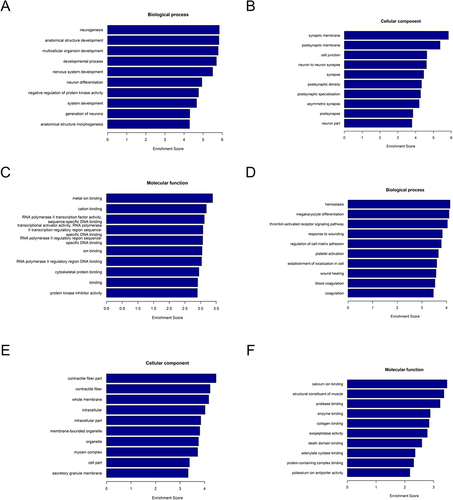
Figure 4 KEGG pathway analysis. The spot size represents the number of genes associated with the listed pathway, while the color represents the p-value. (A) KEGG pathway analysis of the significantly upregulated lncRNAs. (B) KEGG pathway analysis of the significantly downregulated lncRNAs.
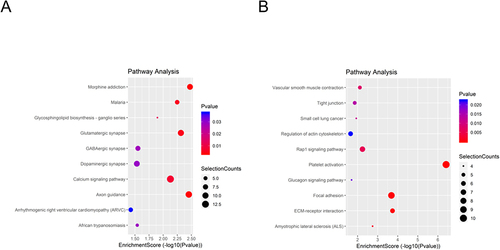
Figure 5 Identification of candidate differentially expressed mRNAs. Venn diagram of (A) upregulated or (B) downregulated genes common to both our mRNAs dataset and GSE76925. (C) The PPI among 343 common differentially expressed genes. (D) PPI network of the top 10 hub genes for upregulated differentially expressed genes.
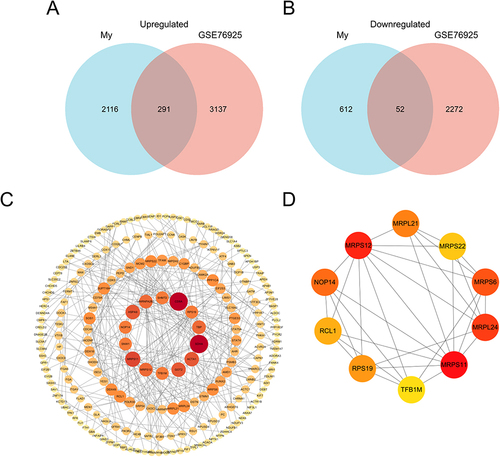
Table 2 The SPEARMAN Relationship Between FEV1/FVC and Top 10 Hub Genes
Table 3 The SPEARMAN Relationship Between FEV1 Predict and Top 10 Hub Genes
Figure 6 Construction of the lncRNA–miRNA–mRNA network. (A) Heat map of GSE70080. Each column represents a blood sample and each row represents a differentially expressed miRNA. (B) The combination of 10 hub genes and miRNA target genes via the two kinds of databases. (C) The union of my lncRNAs dataset and predicted miR-122 and miR-532 target genes from lncACTbd3.0. (D) The lncRNA–miRNA–mRNA network. The circles, diamonds, and squares indicate the lncRNAs, miRNAs, and genes, respectively.
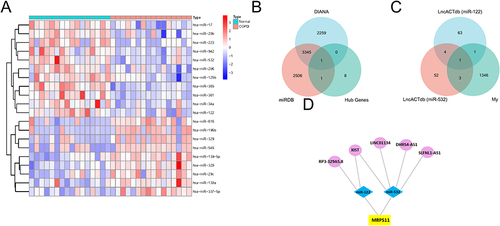
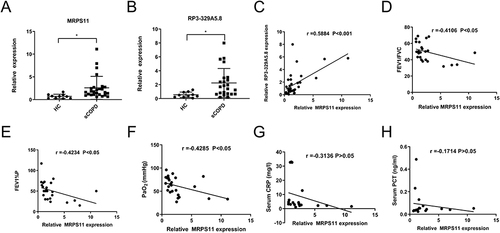
Figure 7 Clinical examination analysis of sCOPD samples. (A and B) Validation of the MRPS11 and RP3-329A5.8 by qRT-PCR. (C) There was a significant positive correlation between the expression level of MRPS11 and RP3-329A5.8. Relationship between pulmonary function (D and E)/oxygen levels (F)/CRP (G)/PCT (H) and the expression of MRPS11. The results are from Pearson correlation analyses. Bars represent the mean ± SEM (n = 5). *P < 0.05.