
Figures & data
Figure 1 Distribution of controlled and uncontrolled patients considering the predominant treatable target and the therapeutic option (GOLD’s follow-up pharmacological treatment algorithm). Percentages in brackets represent the frequency of each treatment option in each respective pathway, whereas those in parentheses are the frequency of control and non-control for each treatment option. Approximately 1% and 2% of patients were not classified in the respective dyspnea and exacerbation pathways because having a different medication pattern.
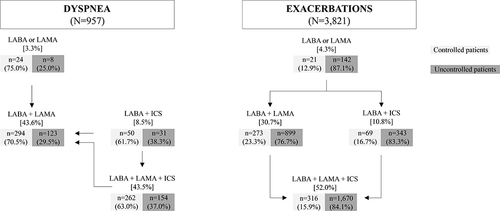
Table 1 Sociodemographic and Clinical Characteristics of Controlled and Uncontrolled Patients Considering Their Therapeutic Option
Table 2 Factors Independently Associated with Lack of Control of COPD Considering the Therapeutic Option