
Figures & data
Table 1 Characteristics of Study Participants According to the Social Frailty Group/Level
Figure 1 Prevalence of the severity of social frailty by age group. The prevalence of social frailty or prefrailty was more than 60% in all age groups. There were no significant differences among groups (P = 0.08).
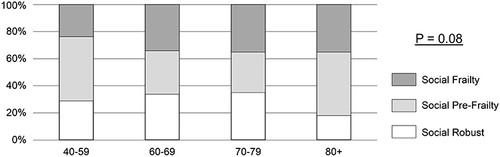
Figure 2 Relationship between social frailty score and clinical factors in patients with chronic obstructive pulmonary disease. Spearman’s rank correlation was used to test this relationship. The total score of social frailty was significantly correlated with each clinical factor (P < 0.05).
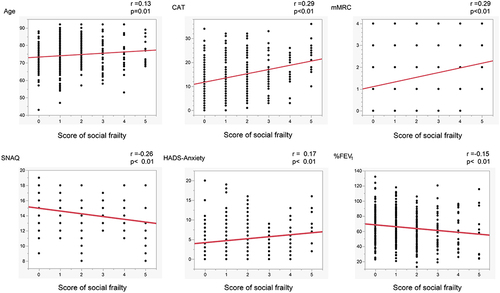
Table 2 Clinical Characteristics of Patients with Social Frailty
Table 3 Impact of Social Frailty on Acute Exacerbation and Unexpected Hospitalization in Patients with Chronic Obstructive Pulmonary Disease