Figures & data
Figure 1 Rb1 ameliorated CSE-induced cell viability and LDH leakage. (A) Structures of Rb1. (B) Cell viability of BEAS-2B cells treated with different concentration of CSE. (C) Cell viability of BEAS-2B cells treated with different concentration Rb1. (D) Rb1 attenuated the CSE-induced decrease in cellular viability in BEAS-2B cells. (E) Rb1 attenuated the release of LDH induced by CSE. *P<0.05, **P<0.01.
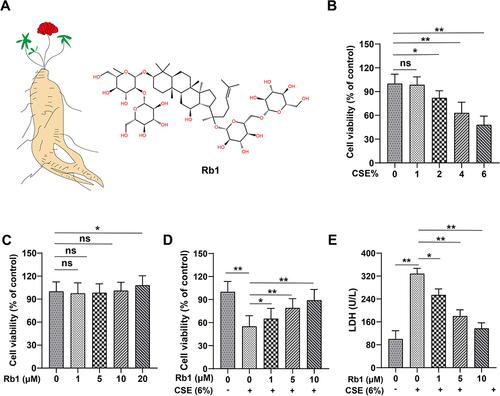
Table 1 The Primer Sequences Used for qPCR Analysis
Figure 2 Rb1 ameliorated CSE-induced inflammation in BEAS-2B cells. (A) Relative mRNA expression level of TNF-α. (B) Relative mRNA expression level of IL-6. (C) Relative mRNA expression level of IL-1β. (D) The concentration of TNF‐α in BEAS-2B cells detected via ELISA. (E) The concentration of IL-6 in BEAS-2B cells detected via ELISA. (F) The concentration of IL-1β in BEAS-2B cells detected via ELISA. **P<0.01.
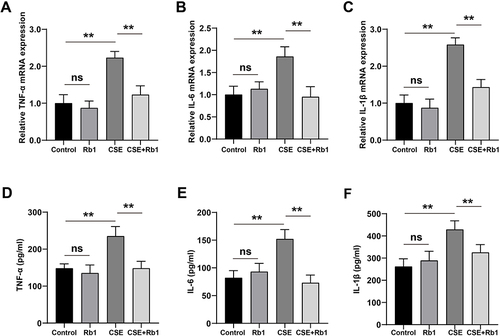
Figure 3 Rb1 ameliorated CSE-induced apoptosis in BEAS-2B cells. (A) Western blot was used to detect the effects of Rb1 on cleaved caspase-3, Bax and Bcl-2 protein expression. (B) Histogram of cleaved caspase-3 protein expression. (C) Histogram of Bcl-2 / Bax protein ratio. (D) Flow cytometry analysis of apoptosis. (E) Apoptosis rate of BEAS-2B cells. (F) TUNEL staining was used to assess the effects of Rb1 on the apoptosis of BEAS-2B cells. (G) Percentage of TUNEL positive cells. **P<0.01.
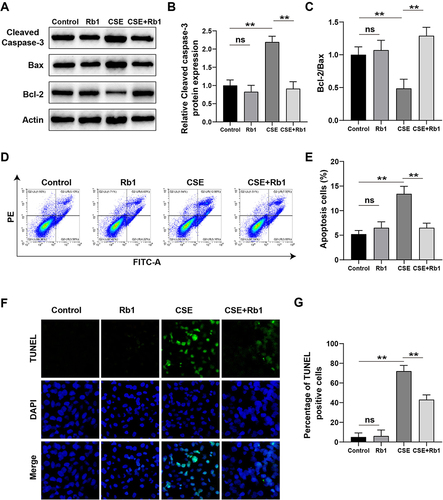
Figure 4 Rb1 ameliorated CSE-induced oxidative stress in BEAS-2B cells. (A) ROS was measured using DCFH-DA fluorescence probe in BEAS-2B cells after Rb1 treatment. (B) Quantification of intensity of the DCFH-DA fluorescence. (C) Representative images of DHE staining. (D) Quantitative analysis of DHE-positive cells. (E–G) The levels of MDA, SOD and CAT. *P<0.05, **P<0.01.
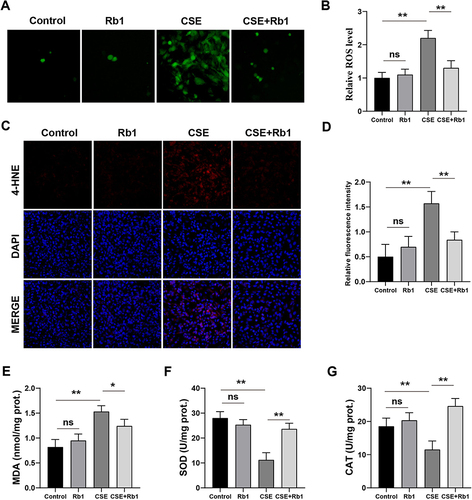
Figure 5 Rb1 abolished the effects of CSE on NF-κB/Nrf2 signaling pathways in BEAS-2B cells. (A) Representative blots and statistical graphs of relative protein expression of p-IκBα and IκBα. (B and C) Representative blots and statistical graphs of relative protein expression of NF-κB in cytoplasm and nucleus. (D), Representative blots of Western blot for cytoplasmic and nuclear Nrf2. (E and F) Statistical graphs of cytoplasmic and nuclear Nrf2 protein. (G–I), Relative mRNA expression levels of HO-1. Nqo1 and Gclc. **P<0.01.
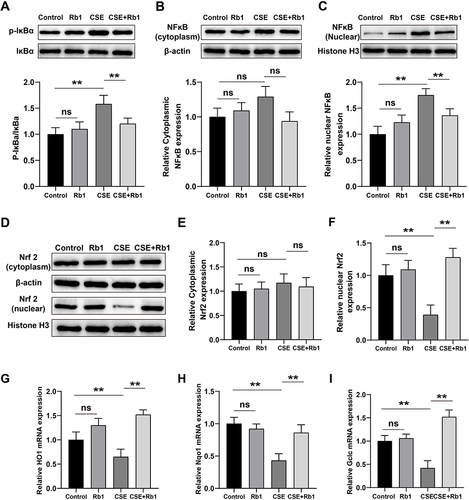
Figure 6 Rb1 alleviated CSE-induced lung injury, apoptosis, oxidative stress and inflammation in rats. (A) Pathological changes of lung tissues after injection of CSE and treatment of Rb1 using HE staining. (B) TUNEL staining detecting cell apoptosis after injection of CSE and Rb1 treatment using HE staining. (C) DHE staining measuring intracellular ROS in COPD and Rb1 treatment rats. (D–F) Relative mRNA expression levels pro-inflammatory cytokines including TNF-α, IL-6, and IL-1β. **P<0.01.
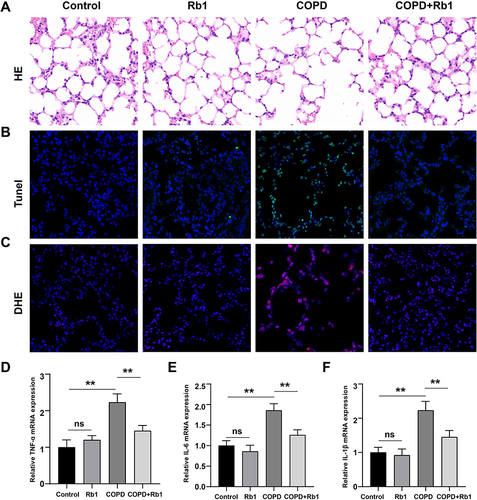
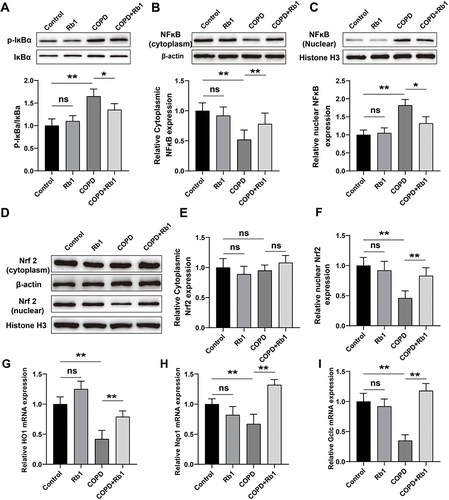
Figure 7 Rb1 activated Nrf2 and inactivated NF-κb signaling pathways in COPD rats. (A) Representative blots and statistical graphs of relative protein expression of p-IκBα and IκBα. (B and C) Representative blots and statistical graphs of relative protein expression of cytoplasmic and nuclear NF-κB. (D) Representative blots of Western blot analysis for cytoplasmic and nuclear Nrf2. (E and F) Statistical graphs of cytoplasmic and nuclear Nrf2 protein. (G–I) Relative mRNA expression levels of HO-1, Nqo1 and Gclc determined by qRT-PCR. **P<0.01, *P<0.05.