
Figures & data
Table 1 Subject Characteristics of Lung Fibroblast Samples Used
Figure 1 The significant differences in expression in fibroblasts from healthy and COPD subjects at baseline represented in (A) a heatmap. (B–E) Plots of genes from the heatmap with more than 30% difference in geomean transcript counts between healthy and COPD at baseline. Dotted line indicates lowest threshold of transcript counts. Statistics: Mann-Whitney U test between healthy and COPD, *p<0.05.
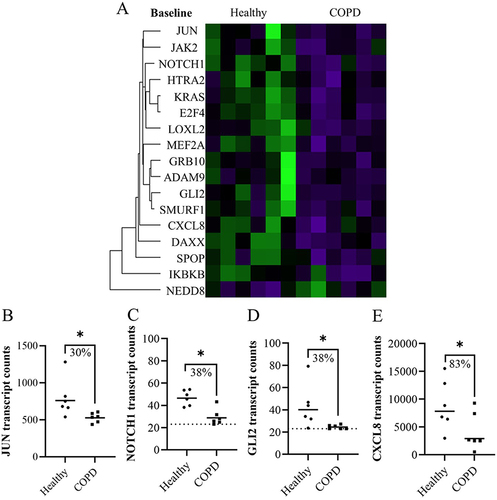
Figure 2 The significant differences in expression in fibroblasts from healthy and COPD subjects 4 hours after CSE stimulation represented in (A) a heatmap. (B) Plot of gene from the heatmap with more than 30% difference in geomean transcript counts between healthy and COPD after CSE stimulation. Dotted line indicates lowest threshold of transcript counts. Statistics: Mann-Whitney U test between healthy and COPD, *p<0.05.
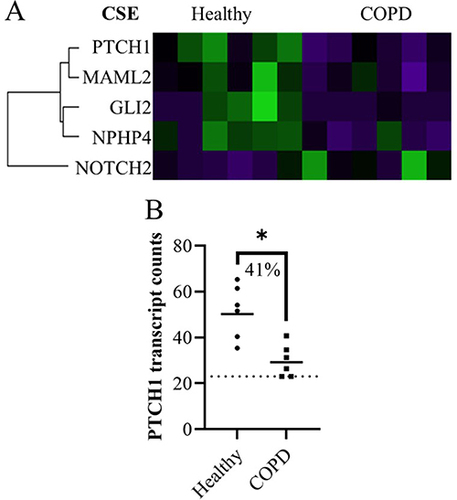
Figure 3 The significant genes that changed expression levels in lung fibroblasts from baseline to after CSE stimulation, first represented as (A) a Venn diagram (relative scale to total number) for the total number of genes in healthy (only), COPD (only) and the overlap that occurred in both. Brackets contain the number of significantly different gene expressions (p<0.05) that increased and decreased for each. (B–F) Plots of genes from the Venn diagram with more than a 50% difference from baseline to CSE stimulation (ie median of paired differences) and less than 25% coefficient of variation (CV) within each timepoint. Statistics: Wilcoxon signed rank test. (G) Other genes with more than 50% difference from baseline to CSE stimulation (ie median of paired differences) but also more than 25% CV. (H) All the absolute percent medians of the paired changes for the 207 healthy and 70 COPD genes (median ± IQR) Statistics: Mann-Whitney U test, *p<0.05, **p<0.01.
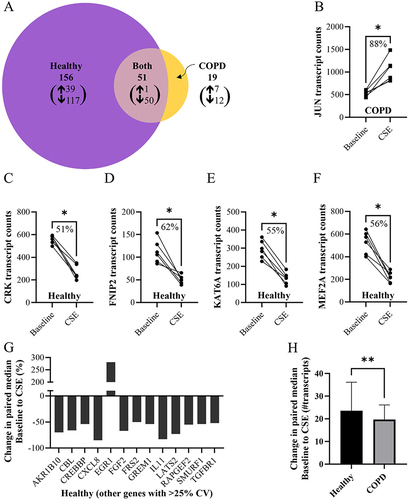
Figure 4 Bar graph of the top 10 enriched gene ontology (GO) terms (listed in order) based on the genes that had significant differences in expression of lung fibroblasts from baseline to after CSE stimulation in (A) healthy and (B) COPD, including genes occurring in both healthy and COPD. Dark blue bars indicate an overlap with the top 10 enriched pathways found from genes that occurred specifically in both healthy and COPD (Figure S7A), grey bars indicate an overlap with top 10 enriched pathways found from all the genes assessed that were above background threshold (Figure S7B), light blue bars indicate enriched pathways of COPD that occurred in the healthy at a lower p-value. Green bars indicate the most unique enriched pathways for each.
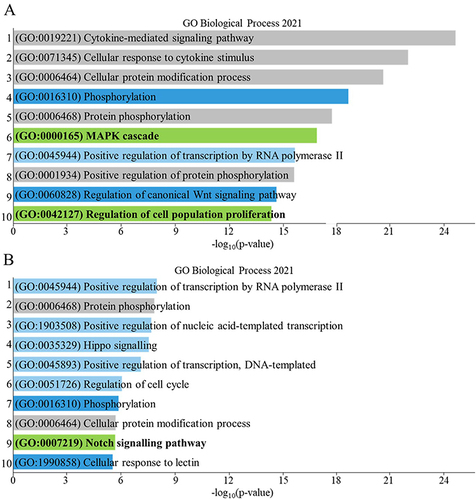
Table 2 Lists of Genes That Significantly Changed Expression Levels from Baseline to After CSE Stimulation That Formed the Enrichr Clusters for Healthy and COPD
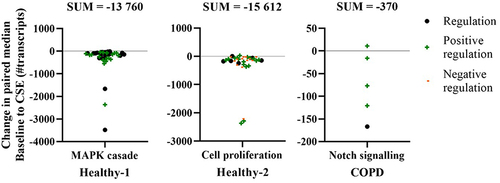
Figure 5 Summary of the clusters derived from the Enrichr analysis of biological processes involved based on the genes that had significant differences in expression in fibroblasts from baseline to after CSE stimulation. Each plot contains all the genes that make up each cluster based on the transcript count change from baseline to after CSE stimulation (above zero = upregulated post-CSE, and below zero = downregulated post-CSE), using symbols to denote type of regulation. Note: 3 genes were removed from the Cell proliferation plot as they were noted as both positive and negative regulators. SUM: sum of all the values in the respective graph.
Data availability Statement
Data will be available upon request to the corresponding author.