
Figures & data
Table 1 The 41 Differentially Expressed Ferroptosis-Related Genes in COPD Samples Compared to Healthy Samples
Figure 1 The differentially expressed ferroptosis-related genes (DEGs) in COPD and healthy samples. (A) Volcano plot of GSE148004. The cutoff logFC (fold change) was −1/1, and P-value is 0.05. Red dots indicate upregulated genes; blue dots indicate downregulated genes; gray dots indicate non-statistically significant genes. (B) Venn diagram of the ferroptosis-related DEGs. (C) Heatmap of the 41 differentially expressed ferroptosis-related genes in COPD and healthy samples.
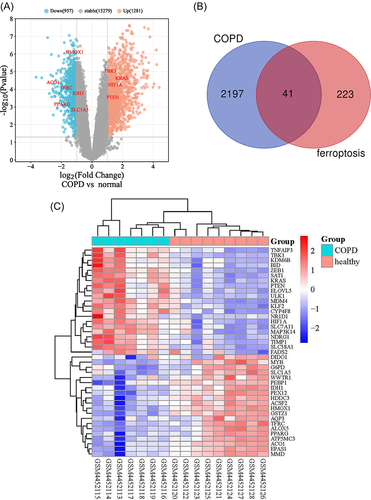
Figure 2 Protein–protein interactions (PPI) analysis the 41 differentially expressed ferroptosis-related genes. (A) The PPI among 41 differentially expressed ferroptosis-related genes. (B) The PPI network constructed with cytoscape. In the figure, nodes in crimson color represent 3 hub genes and yellow and Orange represent other common genes. (C) Spearman correlation analysis of the 41 differentially expressed ferroptosis-related genes.
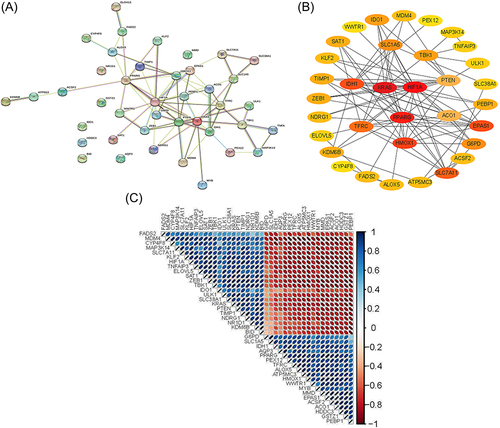
Figure 3 The enrichment of GO terms and KEGG pathways based on 41 ferroptosis-related DEGs in COPD. (A) GO enrichment analysis of the ferroptosis-related DEGs, including biological process(BP), cell composition(CC), and molecular function(MF). (B) GO analysis of the top 5 differentially expressed ferroptosis-related genes. (C) GO analysis of the top 10 differentially expressed ferroptosis-related genes. (D) Kyoto Encyclopedia of Genes and Genomes (KEGG) analysis of 41 differentially expressed ferroptosis-related genes.
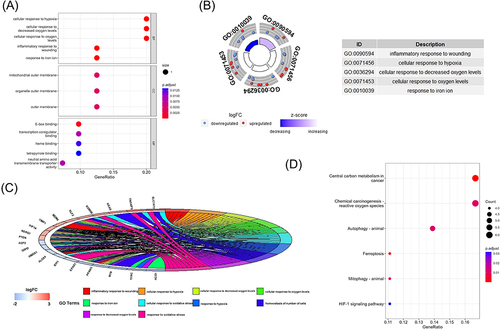
Figure 4 Predictive networks of microRNAs (miRNAs), transcription factors (TFs). (A) Target gene–miRNA network. (B) Target gene–TF network.
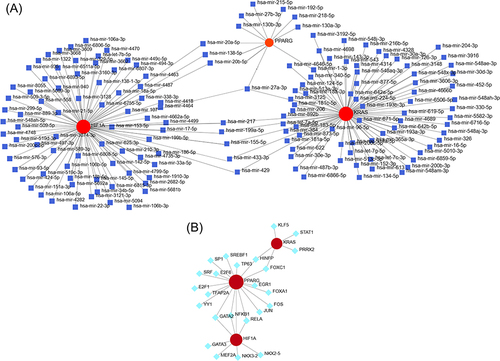
Table 2 Top 10 Drugs with Higher Scores