Figures & data
Figure 1 Cardinal symptoms of COPD and OSA.
Note: The common symptoms of COPD and OSA are noted with potential overlapping symptoms highlighted in the center.
Abbreviations: COPD, chronic obstructive pulmonary disease; OSA, obstructive sleep apnea.
Abbreviations: COPD, chronic obstructive pulmonary disease; OSA, obstructive sleep apnea.
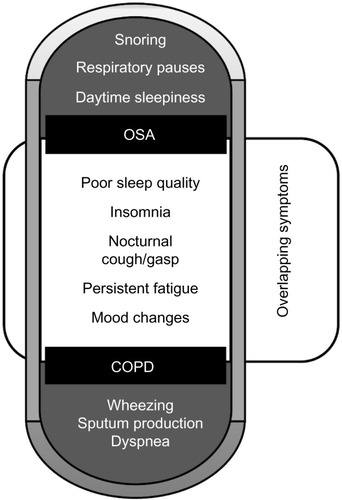
Figure 2 Overlap syndrome.
Note: The overlap syndrome is the synergistic relationship between coexisting chronic pulmonary disease and obstructive sleep apnea.
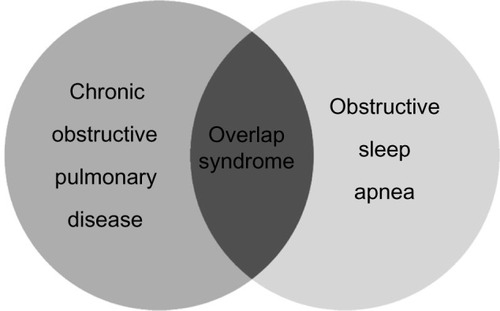
Figure 3 Thoracic physiology during supine sleep.
Notes: Forces effecting thoracic function and functional residual capacity (A), and reduction in diaphragm excursion among patients with hyperinflation (B).
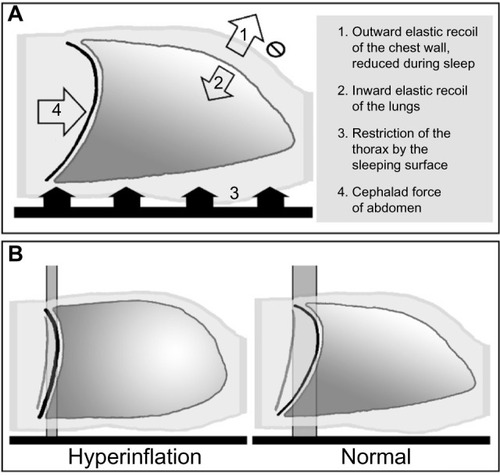
Figure 4 Oxyhemoglobin dissociation curve.
Notes: For an equal 10 point change in the oxygen partial presure (pO2), there is a greater oxygen desaturation when the baseline pO2 is lower (light gray baseline: 80 mmHg has a 2% desaturation; dark gray baseline: 55 mmHg has an 8% desaturation).
Abbreviation: SpO2, oxygen saturation.
Abbreviation: SpO2, oxygen saturation.
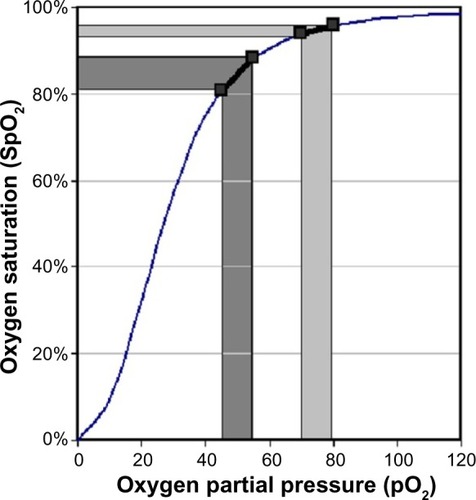
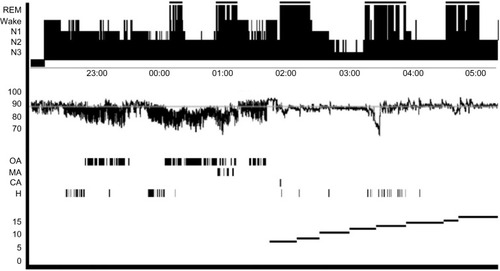
Figure 5 Overnight polysomnogram.
Notes: This summary displays a sleep stage hypnogram, oxygen saturation during the study, apnea and hyponea events, and positive airway pressure settings. Note the continued oxygen desaturations associated with REM despite reduction in apnea and hypopnea events (the gray line indicates 88% saturation).
Abbreviations: REM, rapid eye movement; N1, Sleep Stage 1; N2, Sleep Stage 2; N3, Slow wave Sleep; OA, obstructive apnea; MA, mixed apnea; CA, central apnea; H, hypopnea.
Abbreviations: REM, rapid eye movement; N1, Sleep Stage 1; N2, Sleep Stage 2; N3, Slow wave Sleep; OA, obstructive apnea; MA, mixed apnea; CA, central apnea; H, hypopnea.