Figures & data
Figure 1 State transition diagram of Markov model.
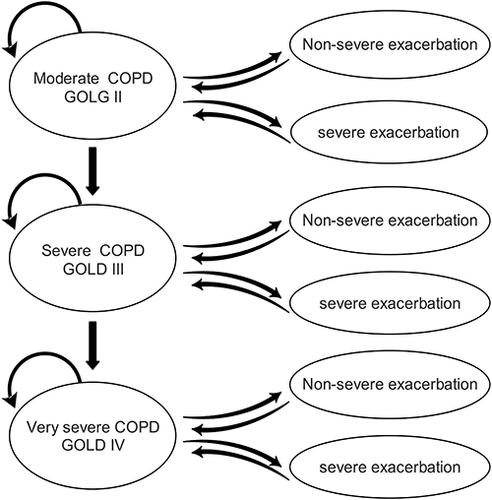
Table 1 Baseline Characteristics
Table 2 The Annual Transition Probabilities for TIO/OLO FDC and TIO
Table 3 COPD-Related Mortality Risk by Age and Severity Stage
Table 4 Health State-Related Utility and Exacerbation-Related Disutility
Table 5 Resource Use and Annual Costs for Markov Model
Table 6 Cost-Effectiveness Analysis of Two Regimens Over 10 Years
Table 7 Model Outcomes versus TOnado Trial on TIO Arm
Figure 2 Tornado diagram (ICER, TIO OLO FDC vs TIO).
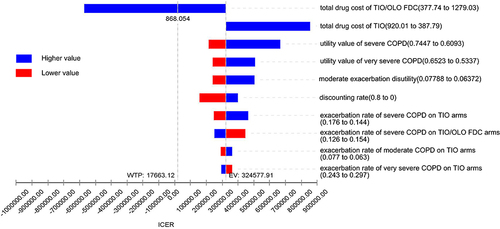
Figure 3 Scatter plot of incremental cost-effective of TIO OLO FDC vs TIO.
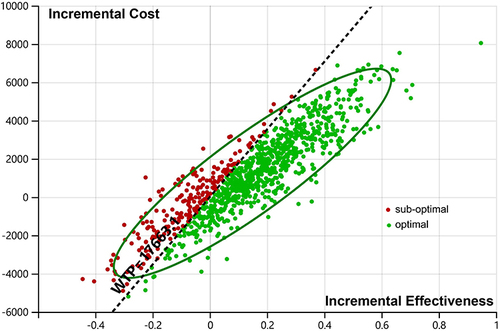
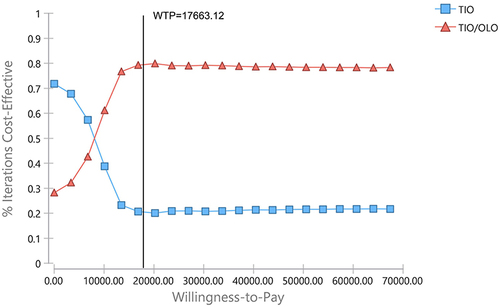
Figure 4 Cost-effectiveness acceptability curve of TIO OLO FDC vs TIO.