Figures & data
Table 1 Baseline Characteristics of Study Population
Figure 1 Pipeline overview. A preview of (A) the preprocessing step per sample, (B) microbiome analysis step, and (C) the pathogen Identification analysis step in integrated samples. In the preprocessing step, we start with a FASTQ file and trim the reads according to the quality of each base and adapter sequences. Then, we align the cleaned reads to CHM13 reference using STAR aligner and extract the reads that do not align with the reference. Alpha and beta diversity can be calculated from abundance determined using Kraken2 and Bracken. To conduct the pathogen identification step, we assign the unmapped reads to the species of Kraken2 database which includes archaea, bacteria, viral, plasmid, etc. Normalized detection amounts are obtained from the z-score from the raw detected count in each sample. The top pathogen in each sample may be a real infected pathogen of the sample.
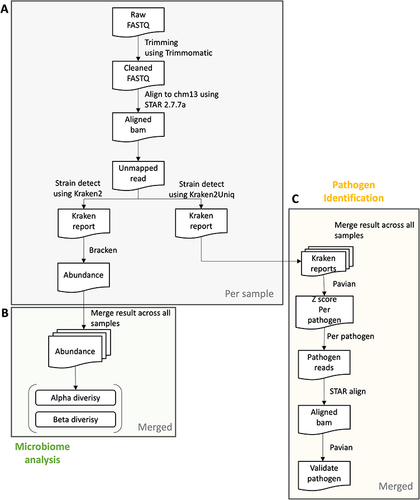
Figure 2 Alpha and beta diversity. (A) alpha diversity (Shannon Index) of normal and COPD groups; the Mann–Whitney U test resulted in a p-value of 2.185e-03. (B) Probabilistic count matrix factorization (pCMF) results using raw read counts. Bray–Curtis dissimilarity (beta diversity) is 0.610.
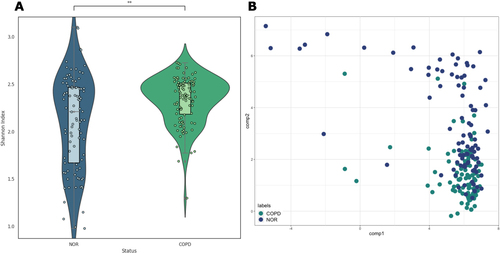
Figure 3 Comparison of overall metagenomic profile between normal and COPD (A). Top 18 species that differ between normal and COPD by z-score. (B) Positive rate detected in Kraken2 Standard database. The rank was sorted by the number of differences between COPD and the normal groups. (C)The percentage of detected reads in each sample. It was sorted by the amount of detected percentage and by the color description of the group. Black: COPD, white: normal (D) Violin plot of Yersinia enterocolitica z-score by normal and COPD (*1.00e-02 < p ≤ 5.00e-02).
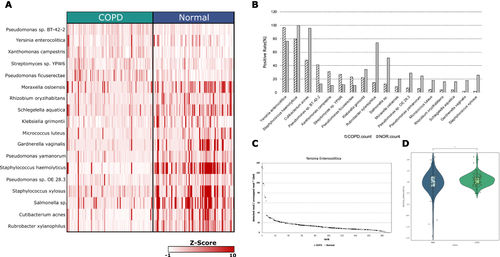
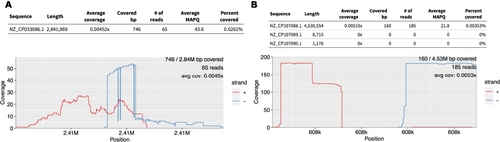
Figure 4 Re-alignment results for each species shown by Pavian Shiny app. (A) Case of false positive, detected as Saccharopolyspora rosea, but actually aligned to the Staphylococcus aureus genome. (B) Result of Yersinia enterocolitica.