
Figures & data
Table 1 Baseline Characteristics of Patients with COPD and Age-Matched Controls
Figure 1 Study flowchart of the inclusion process.
Abbreviations: FEV1, Forced Expiratory Volume in 1 second, % of predicted; OSA, Obstructive Sleep Apnea.
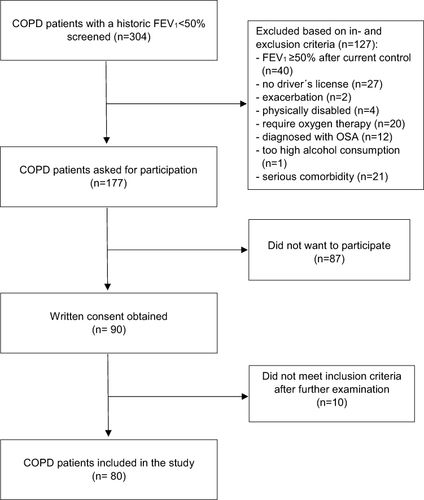
Table 2 Characteristics of Patients with COPD with CI (MoCA Score <26) and without CI (MoCA Score 26–30)
Table 3 Hierarchical Multiple Regression Analyses – Associations of Sociodemographic, Physical and Self-Perceived COPD Symptoms as Well as Psychological Factors and Cognitive Functions in Patients with COPD