Figures & data
Table 1 Baseline Demographics by Patient Clinical Phenotype
Table 2 Baseline Demographics by Burgel Cluster
Figure 1 Overall cohort survival by (a) clinical phenotype and (b) Burgel clusters.
Notes: Cluster 1, very severe comorbid; cluster 2, moderate-to-severe respiratory; cluster 3, moderate-to-severe comorbid/obese; cluster 4, very severe respiratory; cluster 5, mild respiratory (Supplementary Figure 1).
Abbreviations: ACOS, asthma–COPD overlap syndrome; AE CB, frequent exacerbators with chronic bronchitis; AE NON-CB, frequent exacerbators without chronic bronchitis; NON-AE, non-exacerbators.
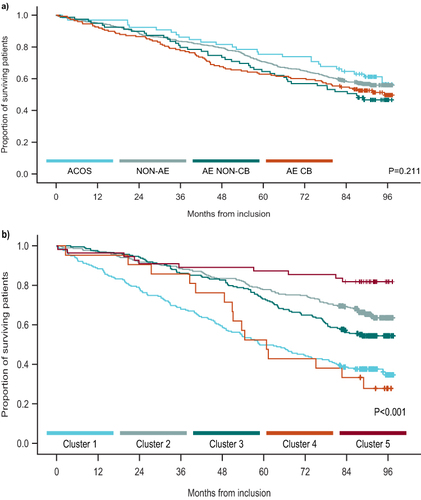
Figure 2 Survival by country.
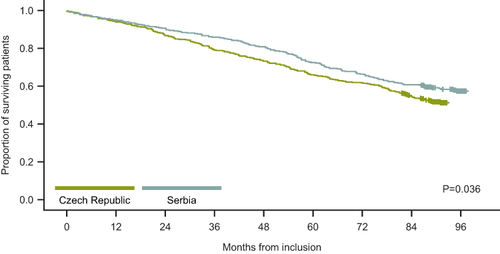
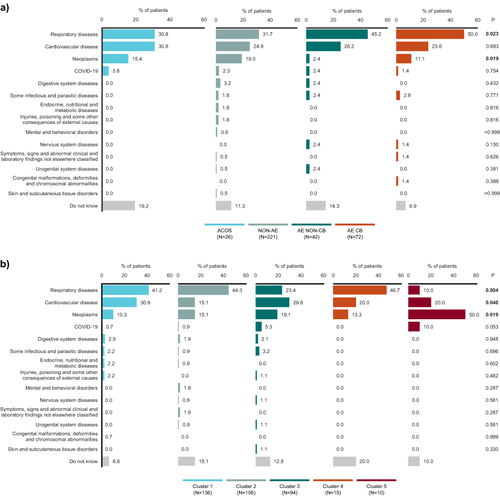
Figure 3 Cause of death by (a) clinical phenotype and (b) Burgel cluster. P-values identified through Fisher’s exact test. P-values which are lower than the statistical significance of 0.05 have been bolded.
Notes: Cluster 1, very severe comorbid; cluster 2, moderate-to-severe respiratory; cluster 3, moderate-to-severe comorbid/obese; cluster 4, very severe respiratory; cluster 5, mild respiratory.
Abbreviations: ACOS, asthma–COPD overlap syndrome; AE CB, frequent exacerbators with chronic bronchitis; AE NON-CB, frequent exacerbators without chronic bronchitis; COVID-19, coronavirus disease 2019; NON-AE, non-exacerbators.