Figures & data
Figure 1 Flowchart of participant selection.
Abbreviations: ICU, intensive care unit; COPD, chronic obstructive pulmonary disease; RCI, red cell index.
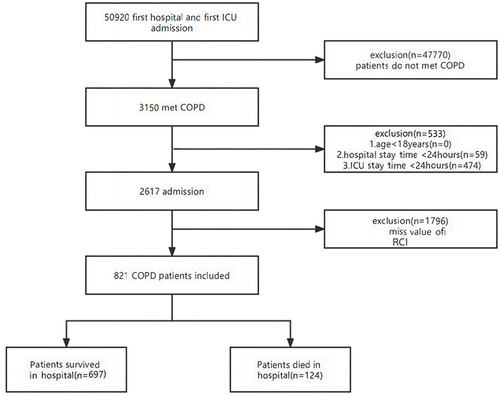
Table 1 Baseline and Clinical Characteristics of the Study Population
Table 2 Univariate Analysis of Risk Factor Associated with Hospital Mortality in Patients with COPD
Table 3 Relationship Between Red Cell Index and Hospital Mortality in Different Models
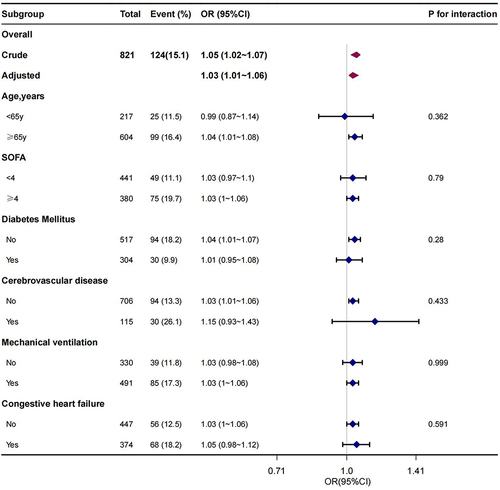
Figure 2 Forest plot of association between red cell index (RCI) and hospital mortality. Crude: unadjusted; Adjusted: adjusted for gender, age, race, HR, RR, SBP, SpO2, cerebrovascular disease, liver disease, congestive heart failure, diabetes, anion gap, chloride, bicarbonate, BUN, Scr, ALT, AST, APSII, OASIS, SOFA, mechanical ventilation.
Abbreviations: OR, odds ratio; CI, confidence interval; HR, heart rate; RR, respiratory rate; SBP, systolic blood pressure; SpO2, pulse oximetry derived oxygen saturation; BUN, blood urea nitrogen; Scr, serum creatinine; ALT, alanine transaminase; AST, aspartate transferase; SAPS II, simplified acute physiology score II; OASIS, oxford acute severity of illness score; SOFA, sequential organ failure assessment.