Figures & data
Figure 1 EP induces emphysema, and blocking the CD40-CD40L pathway reduces emphysema in mice. (A) Representative images of lung sections showing the pulmonary pathology of the control group, EP group, and EP+anti-CD40 group. Comparison of the lung (B) MLI and (C) DI among the three groups. Data are expressed as the mean ± standard deviation (n = 8 in each group). **P < 0.01, ***P < 0.001.
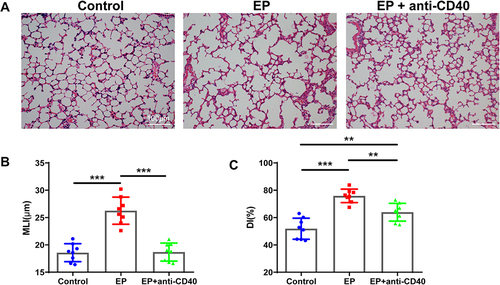
Figure 2 EP induces mDC expansion in mice. (A) Representative flow cytometric scatter plot of the proportions of mDCs in the spleen and lungs in the control group, EP group, and EP+anti-CD40 group. (B) Comparisons of the proportions of mDCs in the spleen and lungs among the three groups. Data are expressed as the mean ± standard deviation (n = 8 in each group). *P < 0.05, ***P < 0.001.
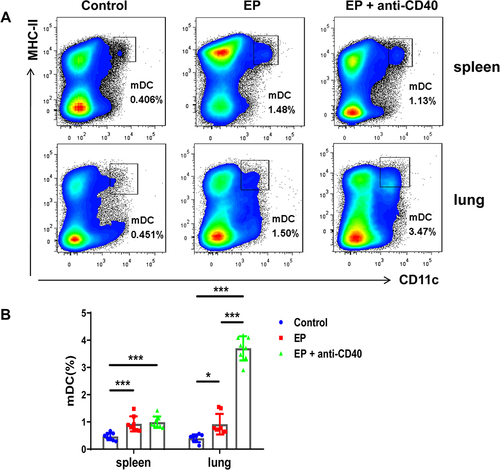
Figure 3 Effect of anti-CD40 antibody on CD40+ mDC expression. (A) Representative flow cytometric histogram of mDCs in the spleens and lungs of the control group, EP group, and EP+anti-CD40 group. (B) Comparisons of the proportions of CD40+ mDCs in the spleen and lungs among the three groups (n = 8 mice/group). (C) Comparisons of the GFI of CD40 in mDCs among the three groups. Data are expressed as the mean ± standard deviation (n = 8 in each group). *P < 0.05, **P < 0.01, ***P < 0.001.
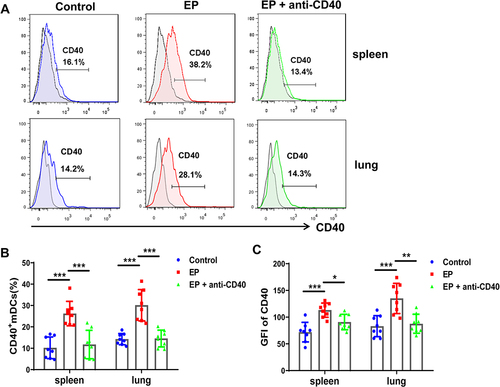
Figure 4 Blocking the CD40-CD40L pathway reduces EP-induced Th17 and Th1 cell responses in mice. (A) Gating strategy for Th1 and Th17 cells. Lymphocytes were identified based on FSC and SSC. Th1 cells were identified as CD4+IFN-γ+ cells, whereas Th17 cells were identified as CD4+IL-17+ cells. (B) Representative flow cytometry scatter plot of Th1 and Th17 cells in the spleens and lungs of the control group, EP group, and EP+anti-CD40 group. Comparisons of the proportions of (C) Th1 and (D) Th17 cells in the spleen and lungs among the three groups. Data are expressed as the mean ± standard deviation (n = 8 in each group). *P < 0.05, ***P < 0.001.
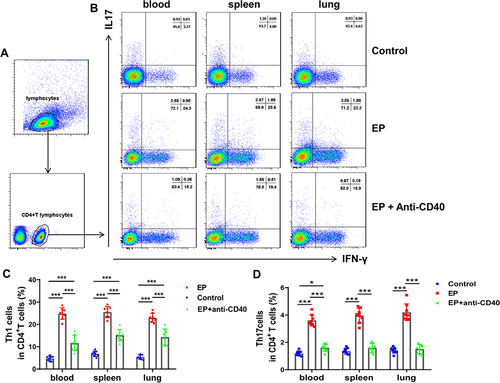
Figure 5 Blocking the CD40-CD40L pathway recovers Treg cells, which are depressed in EP-induced mice. (A) Representative flow cytometry scatter plot of Treg cells in the spleens and lungs of the control group, EP group, and EP+anti-CD40 group. (B) Comparisons of the proportions of CD4+CD25+FOXP3+ Treg cells in the spleen and lungs of the three groups. Data are expressed as the mean ± standard deviation (n = 8 in each group). *P < 0.05, **P < 0.01, ***P < 0.001.
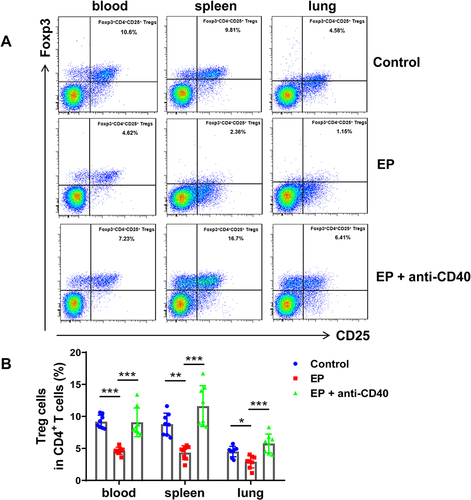
Figure 6 Comparisons of the relative mRNA expression levels of (A) Ifn-γ, (B) Rorγt, and (C) Foxp3 in the spleens and lungs of the control group, EP group, and EP+anti-CD40 group. Data are expressed as the mean ± standard deviation (n = 8 in each group). *P < 0.05, **P < 0.01, ***P < 0.001.
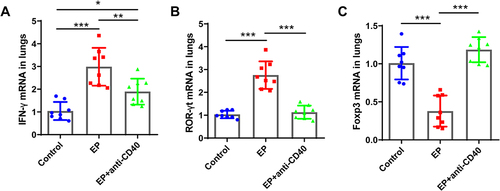
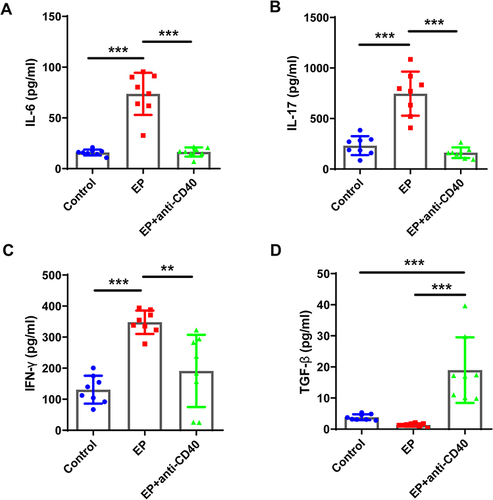
Figure 7 Comparisons of the levels of IL-6, IL-17, IFN-γ, and TGF-β in BALF. BALF was obtained from mice in the three groups and examined using ELISA. Comparison of the concentrations of (A) IL-6, (B) IL-17, (C) IFN-γ, and (D) TGF-β in BALF among the three groups. Data are expressed as the mean ± standard deviation (n = 8 in each group). **P < 0.01, ***P < 0.001.