Figures & data
Table 1 Demographic and Baseline Characteristics of the Samples in GSE76925
Figure 1 A flowchart of the study.
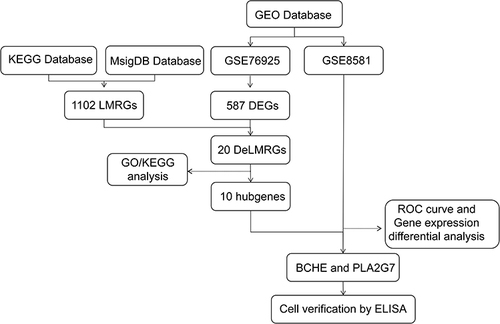
Figure 2 Identification of DeLMRGs in COPD patients. (A) Volcano plot of COPD-related DEGs, graphed with log2FoldChange on the abscissa and -log10 on the ordinate (adjusted P value): Nodes in red represent DEGs up-regulated, nodes in blue represent DEGs down-regulated, and nodes in gray represent genes not significantly differentially expressed. (B) Heat map of top 20 COPD-related DEGs: disease samples are indicated by group1, normal control samples by group2, and high gene expression is indicated by red with low gene expression by blue; (C) Venn diagram of DeLMRGs derived from DEGs and LMRGs intersection: green represents LMRGs, blue represents upregulated DEGs and pink represents downregulated DEGs.
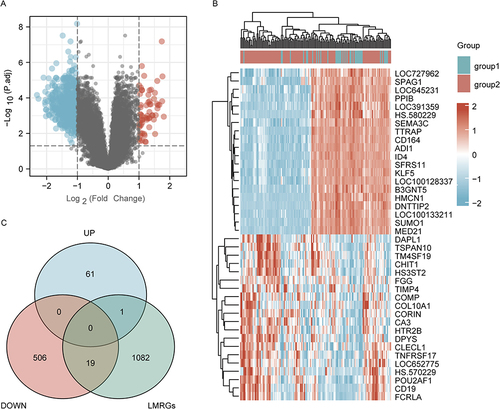
Figure 3 Enrichment analysis of DEGs and DeLMRGs in COPD patients. (A) GO and KEGG enrichment analysis of 587 DEGs. (B) KEGG analysis of 587 DEGs. (C) GO enrichment analysis of 20 DeLMRGs. (D) KEGG enrichment analysis of 20 DeLMRGs.
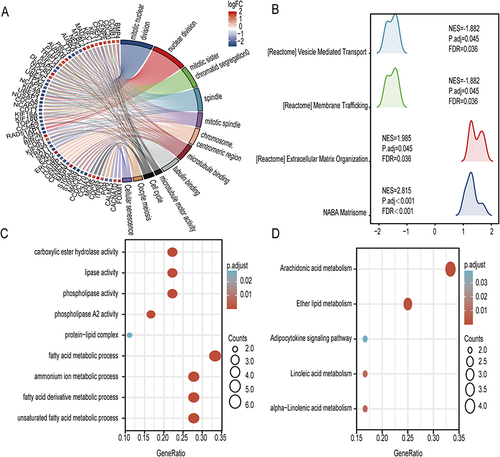
Table 2 Table of Detailed Information About 10 Hub DeLMRGs
Figure 4 PPI network of DeLMRGs. (A) PPI network of 20 DeLMRGs: upregulated genes are shown in red, while downregulated genes are shown in blue. (B) PPI network of 10 hub DeLMRGs: The darker the color, the greater the contribution of genes to the PPI network. The black line indicates the presence of genes that interact.
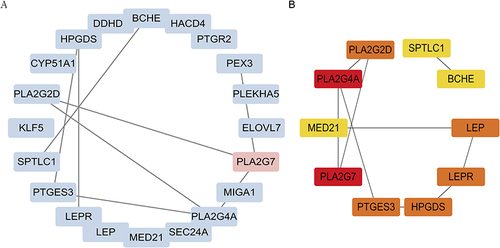
Figure 5 Validation of 9 hub DeLMRGs between COPD and controls in GSE8581. (A) The expressions of BCHE in validation sets. (B) The expressions of HPDGS in validation sets. (C) The expressions of LEP in validation sets. (D) The expressions of LEPR in validation sets. (E) The expressions of PLA2G2D in validation sets. (F) The expressions of PLA2G4A in validation sets. (G) The expressions of PLA2G7 in validation sets. (H) The expressions of PTGES3 in validation sets. (I) The expressions of SPTLC1 in validation sets. *P< 0.05, **P < 0.01.
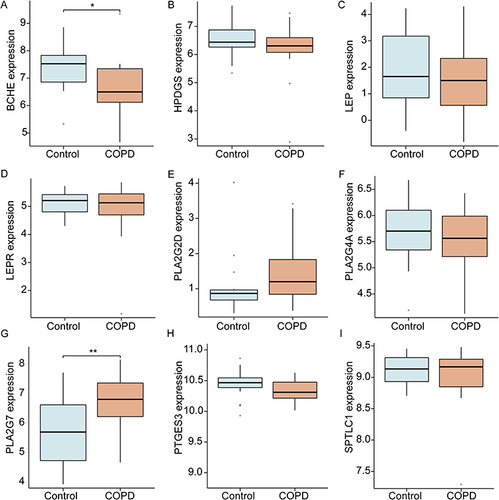
Figure 6 CeRNA regulatory network of lncRNA-miRNA-DeLMRG. (A) Venn diagram showing that 40 miRNAs from TargetScan and miRDB interact with BCHE. (B) Venn diagram showing that 17 miRNAs from TargetScan and miRDB interact with PLA2G7. (C) CeRNA network of BCHE and PLA2G7: red diamonds represent protein-coding genes, blue circles represent miRNAs, green rectangles represent lncRNAs, and black lines represent the interactions between lncRNAs, miRNAs, and mRNAs.
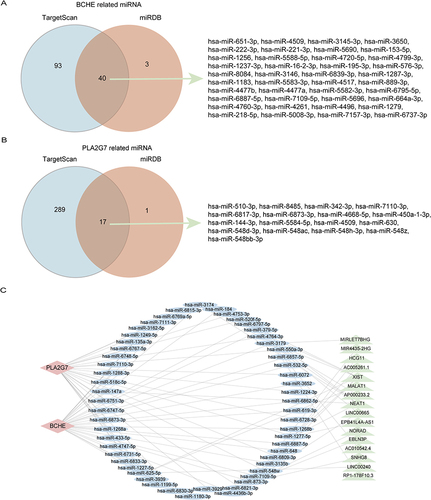
Figure 7 The expression levels of BCHE in macrophages treated with different concentrations of CSE by ELISA. (A) Expression levels of BCHE after different concentrations of CSE treated RAW264.7 cells for 24h. (B) Expression levels of BCHE after different concentrations of CSE treated RAW264.7 cells for 48h. (C) Expression levels of BCHE after different concentrations of CSE treated THP-1 cells for 24h. (D) Expression levels of BCHE after different concentrations of CSE treated THP-1 cells for 48h. Data are presented as mean±sem and differences between groups were assessed by one-way ANOVA. *Indicates the comparison between different CSE administration (0.5–3%) with the blank control group, and *p<0.05; **p<0.01; NS: no significant (P > 0.05).
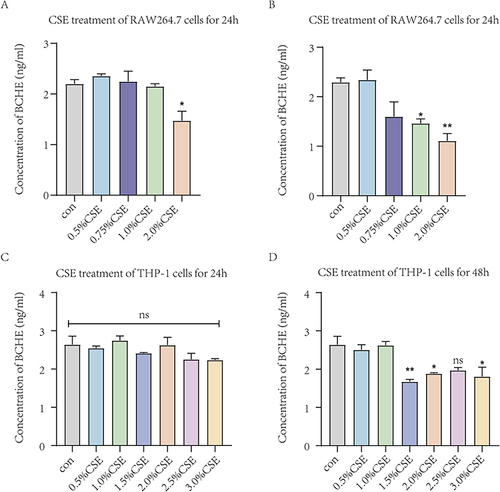
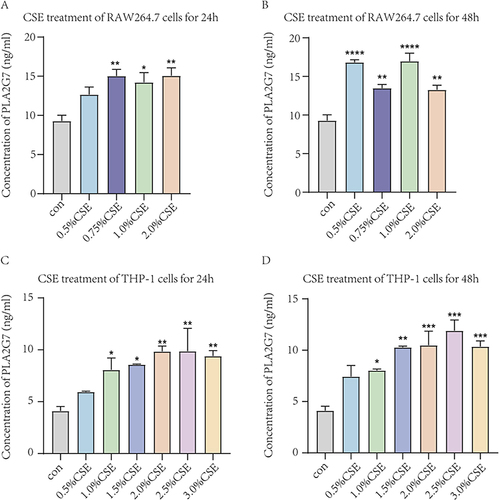
Figure 8 The expression levels of PLA2G7 in macrophages treated with different concentrations of CSE by ELISA. (A) Expression levels of PLA2G7 after different concentrations of CSE treated RAW264.7 cells for 24h. (B) Expression levels of PLA2G7 after different concentrations of CSE treated RAW264.7 cells for 48h. (C) Expression levels of PLA2G7 after different concentrations of CSE treated THP-1 cells for 24h. (D) Expression levels of PLA2G7 after different concentrations of CSE treated THP-1 cells for 48h. Data are presented as mean±sem and differences between groups were assessed by one-way ANOVA. *Indicates the comparison between different CSE administration (0.5–3%) with the blank control group, and *p<0.05; **p<0.01; ***p<0.001; ****p < 0.0001.