
Figures & data
Figure 1 Study diagram showing the flowchart of subject recruitment.
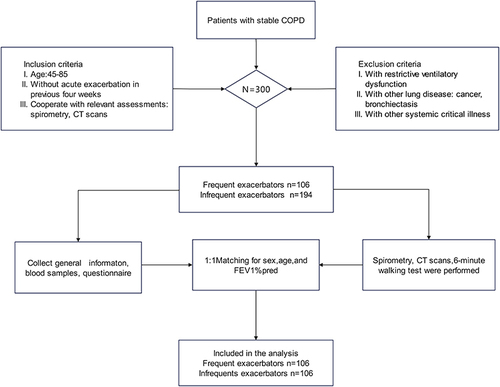
Table 1 Baseline Characteristics of Frequent and Nonfrequent Exacerbators
Table 2 Quantitative CT Parameters and Inflammatory Index Between Frequent and Nonfrequent Exacerbators
Table 3 Association Between the Frequent Exacerbator Phenotype in COPD and Airway Thickening or Systemic Inflammation
Figure 2 Associations between quartiles of Pi10, WA%, IL-1β, or IL-4 and the frequent exacerbation phenotype. The linear association between the odds ratio (OR) and variables was assessed by P for trend using a logistic regression model. (A) OR for quartile of Pi10 associated with the frequent exacerbator phenotype (p for trend <0.001). (B) OR for quartile of WA% associated with the frequent exacerbator phenotype (p for trend <0.001). (C) OR for quartile of IL-1β associated with the frequent exacerbator phenotype (p for trend <0.001). (D) OR for quartile of IL-4 associated with the frequent exacerbator phenotype (p for trend <0.001).
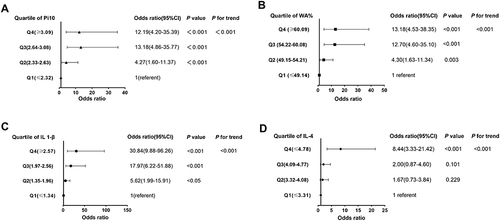
Table 4 Association Between Pi10 and the Inflammatory Index
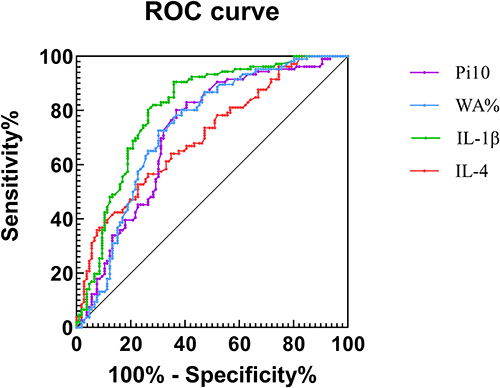
Figure 3 Receiver operating characteristic curve for identification of the frequent exacerbator phenotype. ROC analysis yielded areas under the curve (AUCs) of 0.722, 0.736, 0.807 and 0.706, respectively, for the identification of FE. The greatest sum of sensitivity and specificity occurred at Pi10 = 2.51 mm, WA%=54%, IL-1β=1.686 (pg/mL), and IL-4=4.316 (pg/mL).
Data Sharing Statement
All data generated or analysed during this study are included in this published article.