Figures & data
Figure 1 Composition and definition of the populations included in the analyses.
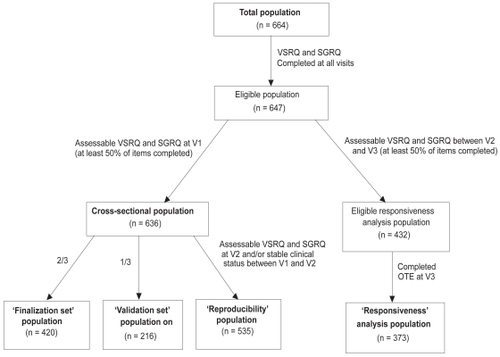
Table 1 Factor pattern of the VSRQ resulting from the Principal Component Analysis (PCA)
Table 2 Reproducibility by test-retest of VSRQ and SGRQ between screening (V1) and baseline visits (V2), ie, two weeks, in stable patients (N = 535)
Table 3 Score distribution for VSRQ and SGRQ according to global health patient groups as assessed by physicians at V1 (N = 636)
Table 4 Spearman correlation coefficients between VSRQ and SGRQ at screening visit (n = 636) (p < 0.0001)
Figure 2 Responsiveness of VSRQ global score and SGRQ total score over baseline and three- month visits according to patients’ health status groups measured by A), effect size, B) standardized response mean, and C), Guyatt’s statistic (N = 373).
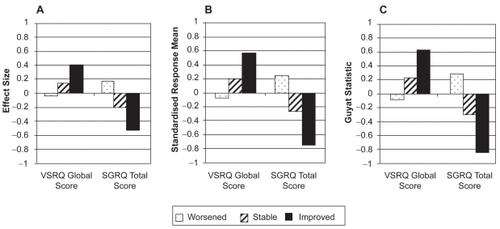
Table 5 Responsiveness to change of VSRQ and SGRQ over three months (N = 373)
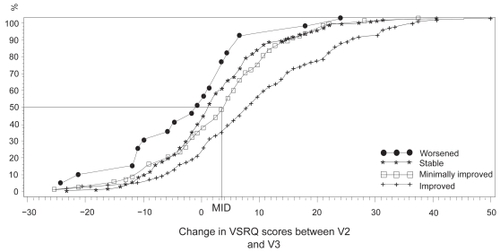
Figure 3 Cumulative response curves according to the evolution of dyspnea for the four health groups defined from the dyspnea Overall Treatment Effect questionnaire. ‘Worsened patients’, n = 30; ‘stable patients’, n = 185; ‘minimally improved’, n = 83; ‘improved’, n = 116.