Figures & data
Figure 1 Rest and exercise spirograms, and placement of rest and exercise tidal breaths on the respiratory system compliance (Pressure – Volume) curve for a healthy individual (a and c) and an individual with chronic obstructive pulmonary disease (COPD) (b and d). End expiratory lung volume (EELV) decreases in the healthy individual during exercise, but increases in COPD, as reflected in increase, and decrease of inspiratory capacity (IC), respectively. The position of VT increases closer to total lung capacity (TLC) for the patient with COPD on the pressure volume curve (c, d) resulting in both a greater reduction in inspiratory reserve volume (IRV) and a larger ventilatory pressure (ΔP) requirement for a given change in volume (ΔV). RV, residual volume. Reprinted with permission of the American Thoracic Society. Copyright © 2023 American Thoracic Society. All rights reserved. O’Donnell DE. Hyperinflation, dyspnea, and exercise intolerance in chronic obstructive pulmonary disease. Proc Am Thorac Soc. 2006;3(2):180–184. The American Journal of Respiratory and Critical Care Medicine is an official journal of the American Thoracic Society.Citation7
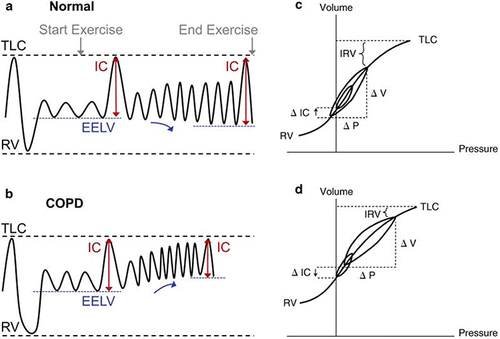
Figure 2 The Campbell diagramCitation10 illustrating pleural pressure (Ppl), lung volume (VL), and work of breathing for a healthy individual (A) compared to one with expiratory airflow obstruction and dynamic hyperinflation (B). In both diagrams, volumes are on the vertical and pressure the horizontal axes. Dashed lines representing normal lung elastic recoil and dotted lines relaxed thoracic recoil; the intersection of these lines is relaxed volume (Vrel). The solid loops and counterclockwise arrows illustrate changes in pressure and volume of a tidal breath. The pressure required of inspiratory muscles throughout the breath (Pmus) is the distance between the dotted line and the inspiratory arm of the loop, illustrated by horizontal arrows. In (A), the tidal loop begins at functional residual capacity (FRC) which is Vrel. Shaded areas represent work of breathing, with blue the work against elastance of the lung and chest wall and yellow work against resistance to airflow. In (B), volumes are shifted upwards and end expiratory lung volume is higher than Vrel due to intrinsic positive end expiratory pressure (PEEPi). The tidal loop spans a greater distance on the pleural pressure axis; leftward excursion to greater negative Ppl results from higher airflow resistance and the corresponding increase in yellow area depicts an associated larger work of breathing. The rightward expansion of the loop results from PEEPi which obligates a greater Pmus at the initiation of breath (arrow) and adds work of breathing represented by the green shaded area. Reprinted from Loring SH, Garcia-Jacques M, Malhotra A. Pulmonary characteristics in COPD and mechanisms of increased work of breathing. J Appl Physiol. 1985;107(1):309–314, Copyright © 2009 the American Physiological Society. Permission conveyed through Copyright Clearance Center, Inc.Citation9
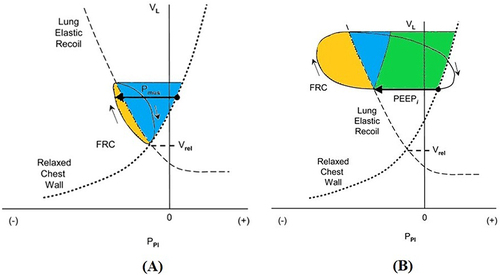
Figure 3 Wasserman nine panel graphical display of CPET data from an incremental cycle ergometer cardiopulmonary exercise tests performed by a healthy 55-year-old man. In the first two columns CPET variables are plotted as functions of time, and the dashed vertical lines demarcate periods of an initial three minutes of rest, three minutes of unresisted cycling, incremental increase in work rate at a rate of 20 W/min, and two minutes of recovery. Dashed horizontal line in (A) indicates the predicted peak O2 for this individual. In the third column, (C), the vertical dashed line indicates predicted peak
O2 and horizontal dashed line the predicted peak heart rate. The diagonal dashed line shows a slope of
CO2 to
O2 of 1.0, and the vertical arrow marks the inflection point in
CO2 typical of the anaerobic threshold (AT). In (F) the horizontal dashed line is fit to the slope of
E against
CO2. In (I), horizontal dashed lines indicate vital capacity (VC) and inspiratory capacity (IC) for this individual measured prior to exercise, and vertical dashed line indicates maximal voluntary ventilation (MVV). Other panels are as follows. (B) shows peak heart rate (HR) and peak O2 pulse (
O2/HR) over time. (D) is ventilatory equivalent for
O2 (
E /
O2) and
CO2 (
E /
CO2) over time. (E) shows respiratory exchange ratio (RER or R) over time. (G) includes partial pressures of arterial CO2 (PaCO2) and O2 (PaO2) and end tidal CO2 (PETCO2) and O2 (PETO2) over time. (H) is minute ventilation (
E) as a function of time. Other abbreviations are as used in the text. Image courtesy with permission from Dr Kathy E Sietsema.
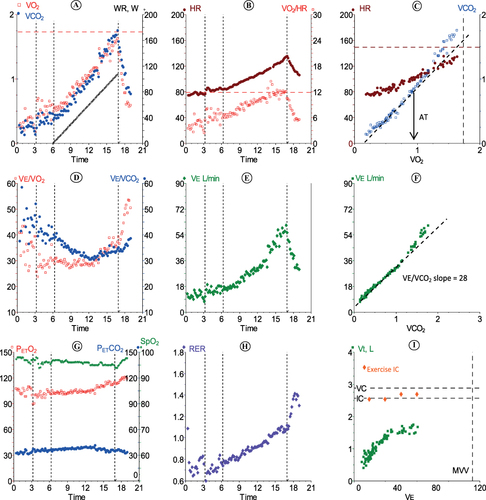
Table 1 Selected Variables Measured During CPET and Their Significance in Patients with COPD
Figure 4 Wasserman nine panel graphical display of CPET data from a test performed by a 50-year-old man with COPD, whose predicted peak exercise values are similar to those of the healthy subject shown in . In this case, the work rate (WR) was increased by 15 W/min during the incremental phase. Data are displayed with same conventions described for . Note findings that contrast with the healthy response including (A) and (C), peak values of both O2 and heart rate (HR) are considerably less than predicted. (I),
E reaches the individual’s maximal voluntary ventilation (MVV) indicating that exercise was terminated due to mechanical limits of breathing. (D) and (F) show that
E was higher relative to
O2 and
CO2 than for the healthy individual; in fact, the slope of
E relative to
CO2was double that for the healthy individual. Other panels are as follows. (B) shows peak heart rate (HR) and peak O2 pulse (
O2/HR) over time. (D) is ventilatory equivalent for
O2 (
E /
O2) and
CO2 (
E /
CO2) over time. (E) shows respiratory exchange ratio (RER or R) over time. (G) includes partial pressures of arterial CO2 (PaCO2) and O2 (PaO2) and end tidal CO2 (PETCO2) and O2 (PETO2) over time. (H) is minute ventilation (
E) as a function of time. Image courtesy with permission from Dr Kathy E Sietsema.
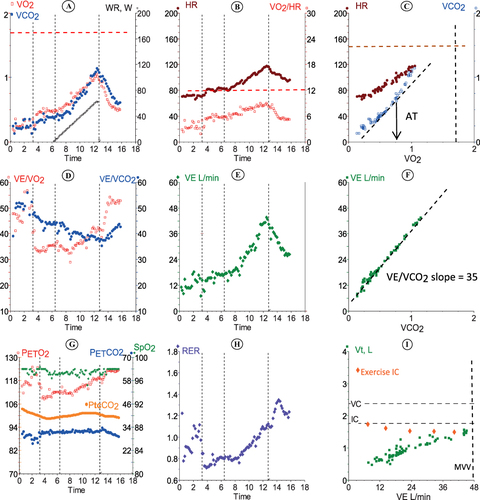
Figure 5 Flow volume loops at rest and exercise. Tidal flow volume loops relative to maximal at rest (solid lines) and exercise (dashed lines) for a healthy individual (Normal, A) and an individual with obstructive lung disease (COPD, B). For Normal, tidal volume expands during exercise by both increase in end inspiratory volume and decrease in end expiratory volume. In COPD, the flow volume tracing of spontaneous breaths moves to the left as end expiratory volume increases due to dynamic hyperinflation. FRC, functional residual capacity. Reprinted with permission from Al Talag A, Wilcox P. Clinical physiology of chronic obstructive pulmonary disease. BCMJ. 2008;50(2):97–102.Citation8
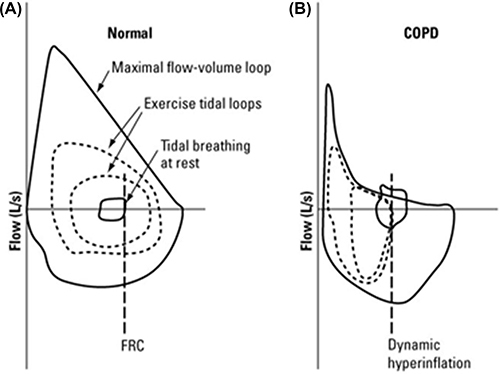
Figure 6 Ventilatory efficiency (E /
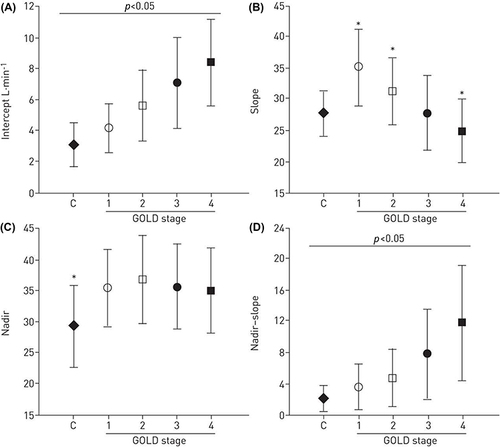
CO2), slope, intercept, and nadir based on severity of COPD (GOLD criteria). The
E/
CO2 slope may paradoxically become lower in more severe disease (graph B). This is because of ventilatory constraints which can result in hypercapnia. Therefore, the more useful variables in COPD are the nadir value of the
E /
CO2 ratio (graph D), and the y-axis intercept of the
E to
CO2 relationship (graph A). The intercept is helpful mainly because it is not constrained by dynamic mechanics (as the slope is) or by duration of the test (as the nadir is). The intercept also correlates better than slope and nadir with exercise tolerance and dyspnea across all stages of COPD. There were important correlations between nadir versus intercept and slope only in controls and GOLD stage 1 patients (r=0.61 and 0.59, respectively, p<0.05). Graph (C) shows that compared to controls, nadirs were increased to a similar extent in all patient groups. Reproduced with permission of the © ERS 2023: Eur Respir J, 45(2): 377-387; Neder JA, Arbex FF, Alencar MCN, et al. Exercise ventilatory inefficiency in mild to end-stage COPD. DOI: 10.1183/09031936.00135514 Published 31 January 2015.Citation62