Figures & data
Table 1 Basic Clinical Data of TOPD Group, COPD Group, TB Group and Healthy Control Group
Figure 1 Distribution characteristics of IgG autoantibodies in peripheral blood of TOPD patients. (A) Show the chip results for the HC group of samples. The image on the left is the global scan of the chip, and the right is the enlarged image of the local chip (Block10). Among them, the green and red channels are 532 nm-IgG and 635 nm-IgM channels, respectively, which are merged into the composite diagram. The red arrow is the positive control point (human IgM, human IgG), and the blue arrow is the negative control point (Biotin-BSA). Yellow arrows are positive points.(B) Volcano and Venn diagram results. (C) up-regulated IgG autoantibody GO and KEGG results. (D) down-regulated IgG autoantibody GO and KEGG results.
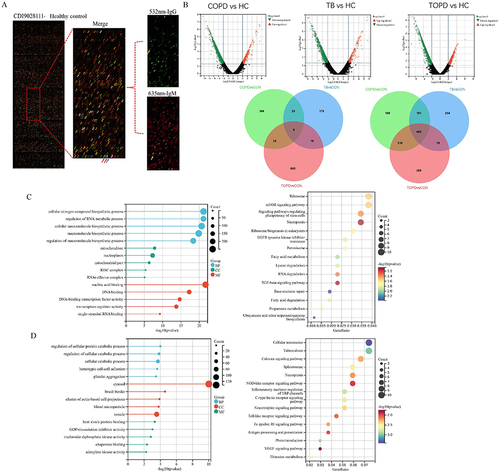
Table 2 Expression of Autoantibodies Associated with COPD in This Study
Figure 2 Distribution characteristics of immune-related IgG antibodies. (A) Heat maps of differentially expressed IgG autoantibodies. (B) Venn diagram, GO and KEGG results of immune-related up-regulated IgG autoantibodies. (C) Venn diagram, GO and KEGG results of immune-related down-regulated IgG autoantibodies.
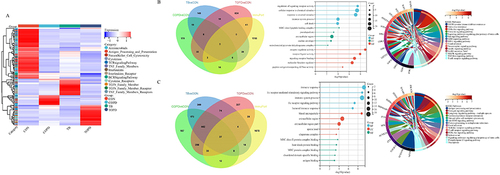
Figure 3 (A) Results of protein-protein interaction network analysis of IgG autoantibody proteins. (B) Results of protein-protein interaction network analysis of IgM autoantibody proteins. (C) Level of PCNA, MAPK3, RUVBL1, GART, AKT1 and RPSA autoantibodies in HC, TOPD, COPD and TB group.Data are shown as mean ± SEM. **P < 0.01.
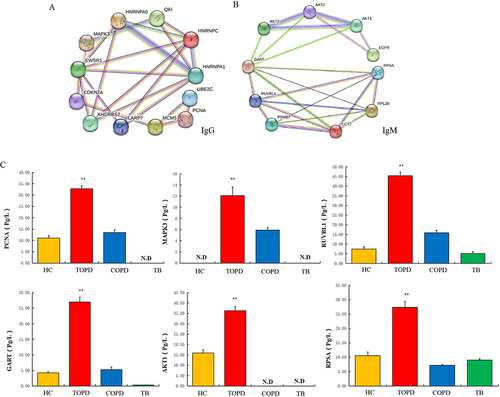
Table 3 Structure Information on Galaxy Refine
Figure 4 (A) Candidate model generated by the Galaxy Refine server, (B) 3D protein model shown by the Ramachandran diagram.
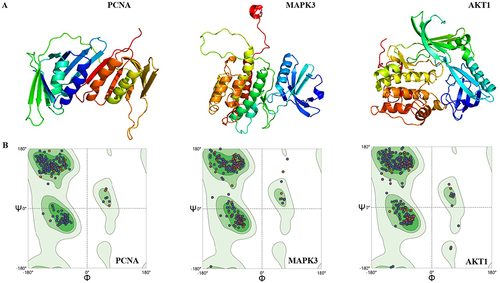
Table 4 PCNA, MAPK3 and AKT1 CTL Epitopes Prediction
Table 5 Th Epitopes of PCNA, MAPK3 and AKT1 Antigenic Peptides
Table 6 Linear Antigenic Peptides in B Cells and Scores
Table 7 Predicted Discontinuous Epitopes
Figure 5 The innate immune responses induced by PCNA, MAPK3, and AKT1 in C-ImmSim server. (A) Expression of NK cells after antigen stimulation. (B) Expression of DC cells (black) after antigen stimulation. (C) Expression in macrophages (black) after antigen stimulation. (D) Secretion from active epithelial cells (purple) after antigen stimulation.
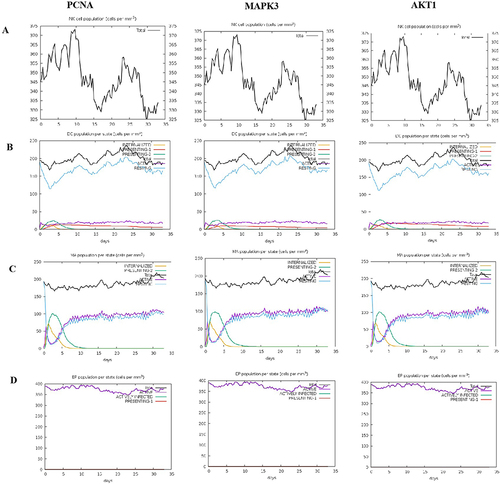
Figure 6 The adaptive immune responses induced by PCNA in C-ImmSim server. (A) Active B cell (purple) secretion after antigen stimulation. (B) The primary B cell antibody produced after antigen stimulation is IgM + IgG (yellow) changes over time. (C and D) Changes in the secretion level of helper T lymphocytes and the secretion levels of helper T lymphocytes of different memory types. (E) Changes in Treg T cell secretion after antigen stimulation. (F and G) Changes in the level of CD8+T secretion after antigen stimulation and the secretion of different types of CD8+T cells. (H). Changes in secretion levels of cytokines, mainly IFN-g (purple) and IL-2 (yellow).
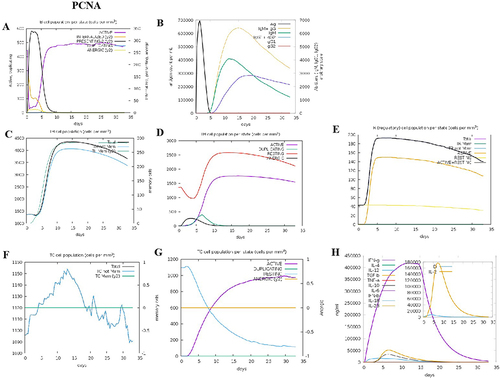
Figure 7 Th cells and Treg cell in different groups. (A) Level of Th1(CD183+CD196−),Th2(CD183− CD196−), Th17(CD183−CD196+) cells in HC, COPD, TB, and TOPD group. (B) Level of Treg cell in HC, COPD, TB, and TOPD group. Data are shown as mean ± SEM.*P < 0.05, **P < 0.01, ***P < 0.001.
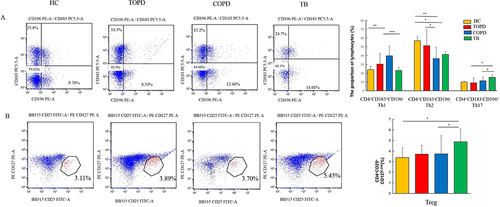
Figure 8 ILC cells in different groups. Level of ILC1 (Lin−CD45+CD127+CRTH2−CD117−),ILC2(Lin−CD45+CD127+ CRTH2+CD117±), and ILC3(Lin−CD45+CD127+CRTH2−CD117+) cells in HC, COPD, TB, and TOPD group. Data are shown as mean ± SEM.*P < 0.05, **P < 0.01, ***P < 0.001.
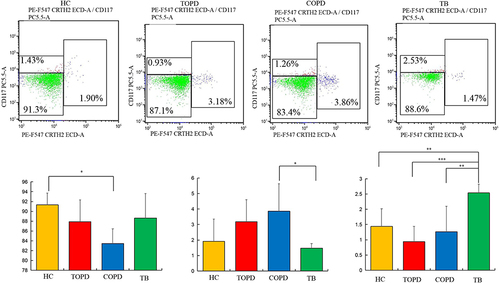
Figure 9 Macrophage cells in different groups. Level of M1(CD14+CD68+CD86+), M2(CD14+CD68+CD206+) cells in HC, COPD, TB, and TOPD group. Data are shown as mean ± SEM.*P < 0.05, **P < 0.01, ***P < 0.001.
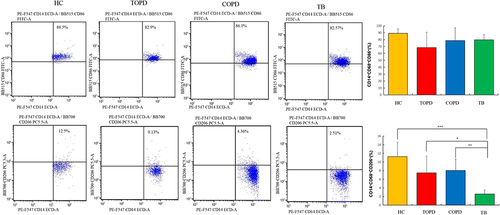
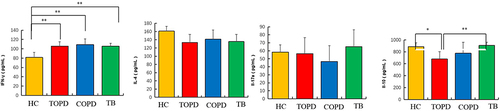
Figure 10 IFN-γ was highly expressed in peripheral blood of TOPD patients. Serum IFN-γ, IL-4, IL-17a and IL-10 expression in patients with TB, TOPD, COPD and healthy controls. Data are shown as mean ± SEM.*P < 0.05, **P < 0.01.