Figures & data
Figure 1 Extraction of pulmonary vessels based on low-dose CT images. (a) showed tracing pulmonary vessels from low-dose chest CT images. (b) showed extraction of pulmonary vessels.
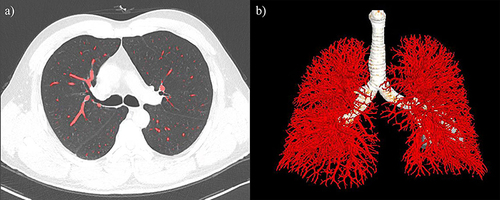
Figure 2 Diagram of area and surface area of small pulmonary vessel. (A) represented the vascular surface area within the solid line. (B) represented the vascular area within the dashed line.
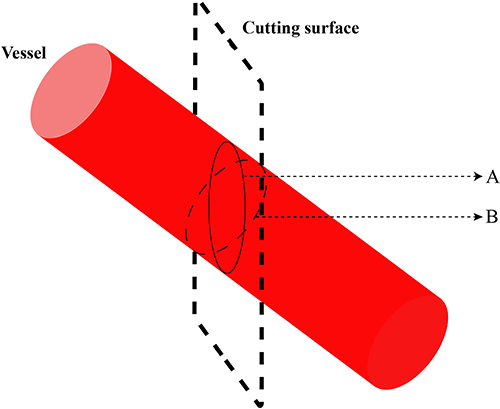
Table 1 Demographic and Clinical Characteristics and PFT Among Normal, High Risk for COPD and COPD Groups
Table 2 Differences in Parameters of Pulmonary Vessels Among Normal, High Risk for COPD and COPD Groups
Figure 3 Difference in small pulmonary vessel parameters among normal, high risk for COPD and COPD groups. No. Vessels and total vessel surface area at 6mm below pleura and BV5 (blood vessel volume in vessels with a cross-sectional area less than 5mm2) in high risk for COPD subjects were less than that in normal subjects (P<0.05). No. Vessels at 6mm below pleura in COPD subjects was less than that in normal subjects, but No. Vessels at 9mm below pleura in COPD subjects was more than that in normal subjects (P<0.05). Total vessel surface area at 6mm below pleura and BV5 (blood vessel volume in vessels with a cross-sectional area less than 5mm2) in COPD subjects were also more than that in normal subjects (P<0.05).
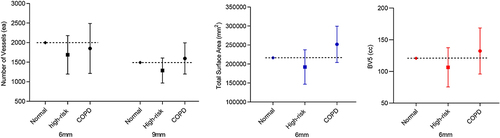
Table 3 Differences in Pulmonary Vessel Parameters Among Never-Smokers, Current-Smokers and Former-Smokers in Group at High Risk for COPD
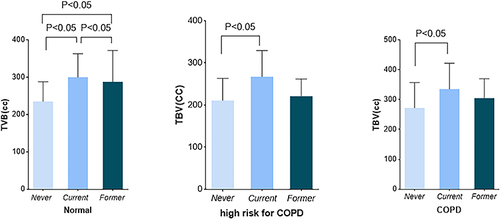
Figure 4 Total blood volume among subjects with different pulmonary function compared with smoking status. TBV (total blood volume) in never-smoker with high risk for COPD was less than that in current-smoker with high risk for COPD (P<0.05). This difference can also be seen in the normal and COPD subjects. Moreover, TBV in never-smokers with normal PFT (pulmonary function test) was less than that in current-smokers with normal PFT (P<0.05).