Figures & data
Table 1 Characteristics of the Study Participants
Figure 1 Shannon sparse curve of each sample OTU operational taxon unit.
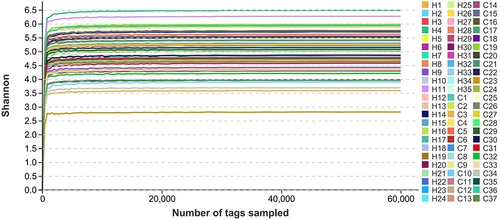
Table 2 Description of methods and Results of Microbial Diversity and Evenness Assessment
Figure 2 Beta diversity analysis. (A) NMDS of the unweighted_unifrac distance metric. (B) ANOSIM of the unweighted_unifrac distance. Between represents the distribution of two-sample distances between health and COPD. Each scatter point represents the distance between two samples.
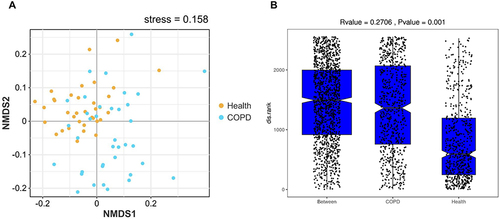
Figure 3 Differences in intestinal microbiota. (A) A stacked bar chart showed the distribution of dominant intestinal microbiota at the phylum level. (B) A stacked bar chart showed the distribution of dominant intestinal microbiota at the genus level. (C) Wilcoxon test results showed the relative OTU abundance of 15 genus intestinal microbiotas in COPD patients was significantly different from healthy controls. Each scatter represents the relative abundance of this bacterium in each sample.
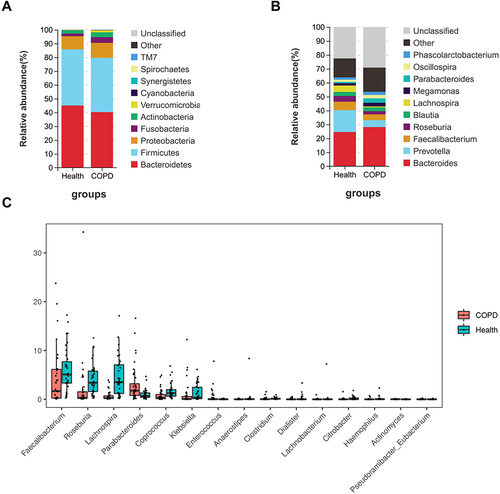
Figure 4 Heat map of Spearman correlation analysis regarding differential intestinal microbiota and clinical characteristics (A) and treatment regimens (B). The correlation index in COPD or health samples is indicated by the color bar on the right side of the heat map.
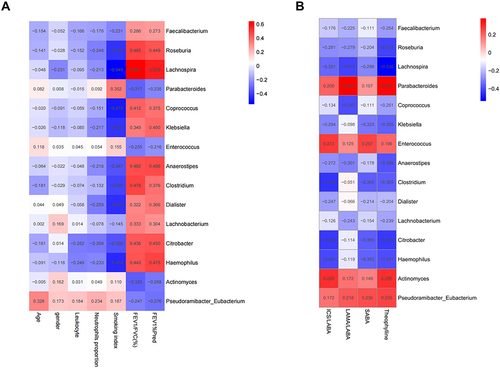
Figure 5 The ability of intestinal microbiota to identify patients with COPD. (A) The illustration of the error changed with the number of trees. (B) Illustration of the tuning of the mtry hyperparameters. (C) ROC curve of the training set and testing set of the Random Forest Model . (D) ROC curve of the Random Forest Model of differential intestinal microbiota. (E) The mean decreases in the Gini coefficient and accuracy plot.
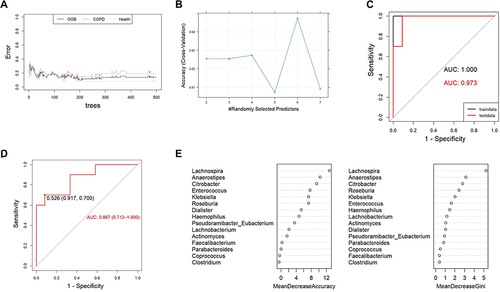
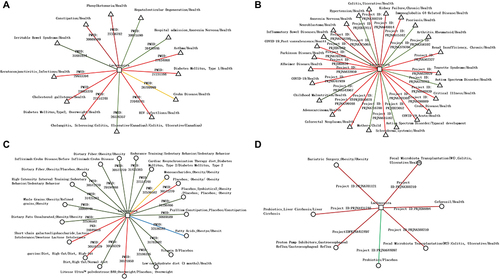
Figure 6 Disease-related network of key intestinal microbiota. (A and B) Diseases types associated with Lachnospira based on Literature-based associations (A) and Raw data-based associations (B). (C and D) Interventions change the abundance of Lachnospira based on Literature-based associations (C) and Raw data-based associations (D).