Figures & data
Table 1 Characteristics of All Studies Included in Meta-Analysis
Figure 1 PRISMA (preferred reporting items for systematic reviews and meta-analysis) flow diagram.
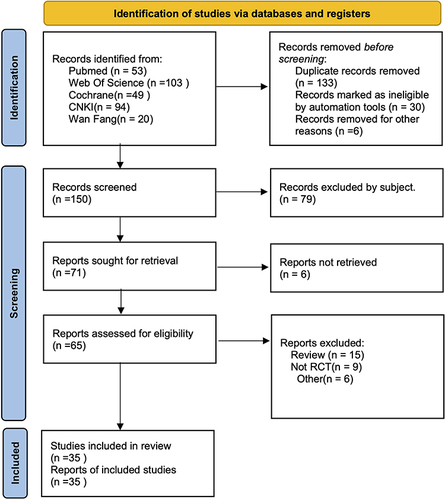
Figure 2 Forest plot of FEV1, subgroup analysis was performed according to variable of heart failure and no heart failure.
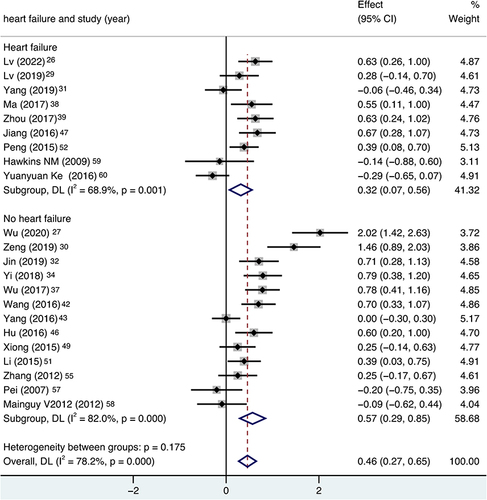
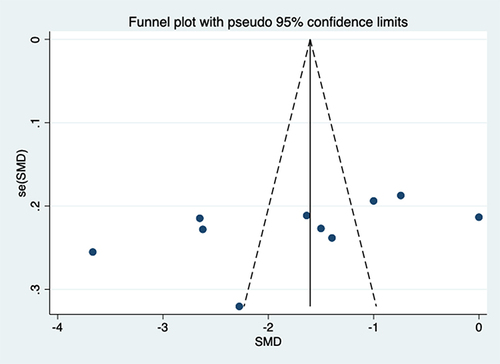
Figure 3 Funnel plot of FEV1.
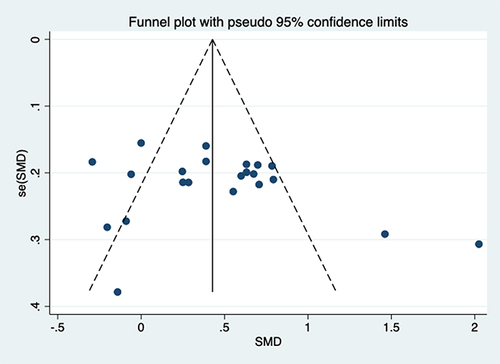
Figure 4 Forest plot of FEV1%, subgroup analysis was performed according to variable of heart failure and no heart failure.
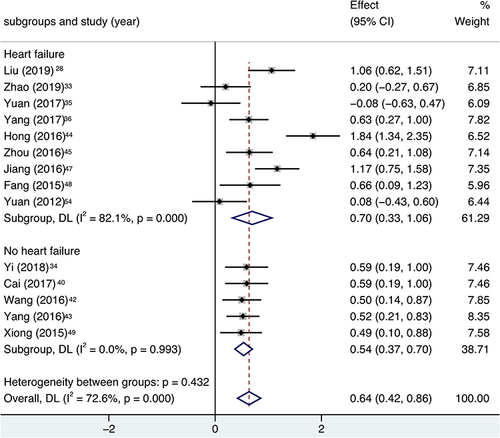
Figure 5 Funnel plot of FEV1%.
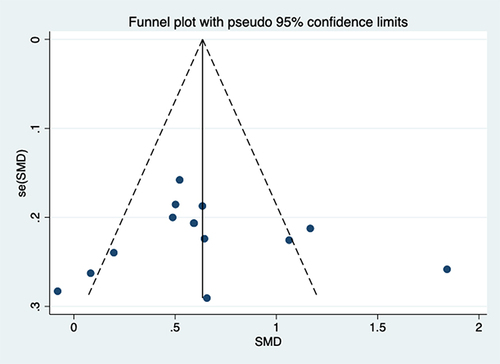
Figure 6 Forest plot of FVC, subgroup analysis was performed according to variable of heart failure and no heart failure.
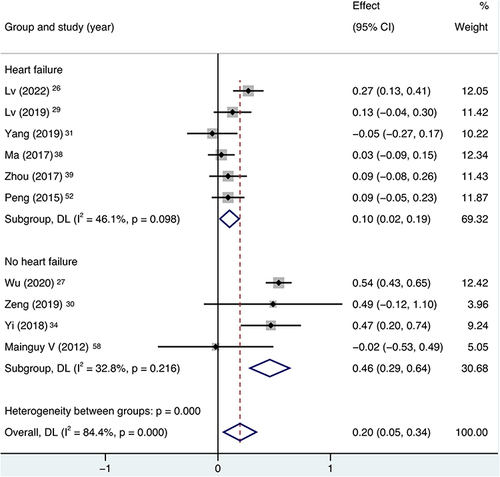
Figure 7 Funnel plot of FVC.
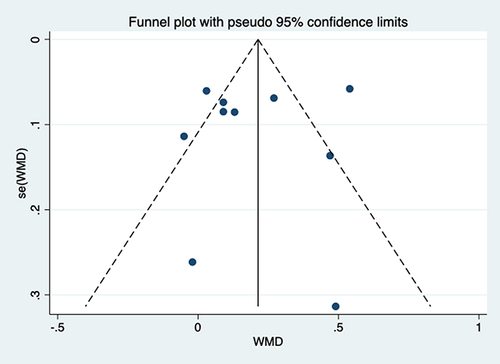
Figure 8 Forest plot of 6-minute walking distance (6MWD), subgroup analysis was performed according to variable of heart failure and no heart failure.
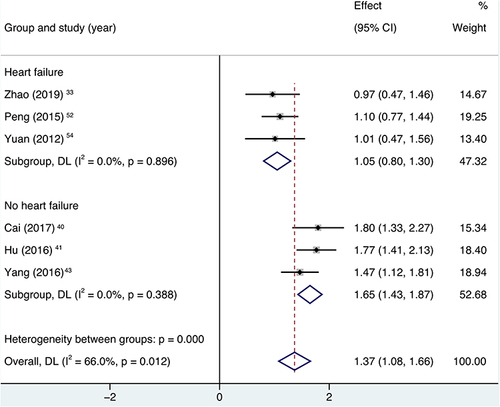
Figure 9 Forest plot of adverse events, subgroup analysis was performed according to variable of heart failure and no heart failure.
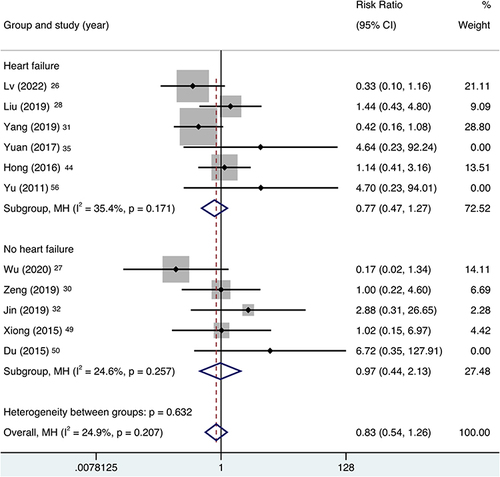
Figure 10 Forest plot of IL-6, subgroup analysis was performed according to variable of heart failure and no heart failure.
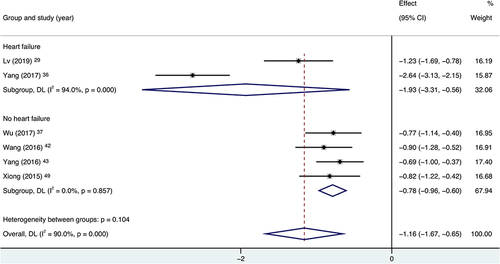
Figure 11 Forest plot of IL-8, subgroup analysis was performed according to variable of heart failure and no heart failure.
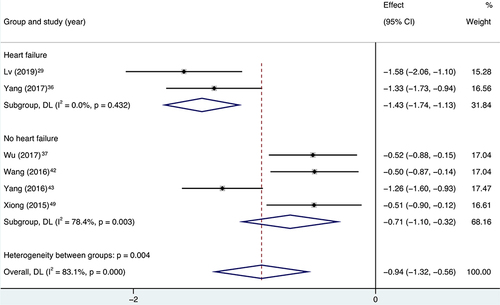
Figure 12 Forest plot of CRP, subgroup analysis was performed according to variable of heart failure and no heart failure.
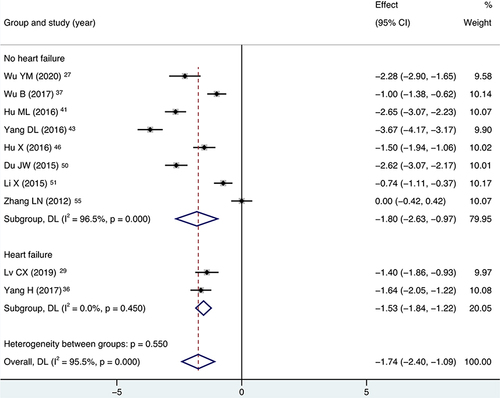
Figure 13 Funnel plot of CRP.