
Figures & data
Table 1 Demographic and Clinical Characteristics of the Women Participating in the Study
Table 2 Concentration of Biomarkers in Women with COPD from Wood Smoke (WS), Tobacco Smoke (TS) and Healthy Controls
Figure 1 Cytokine levels by Group. (A) CCL5; (B) IL-8; (C) MMP-9; (D) VEGF-1.
Notes: P values using two-tailed Mann–Whitney U-Test, exact method. For comparison of WS-COPD and TS-COPD, we used de Bonferroni correction.
Abbreviations: TS-COPD, COPD from exposure to tobacco smoke; WS-COPD, COPD from exposure to wood smoke; MMP-9, matrix metalloproteinase 9; CCL5, chemokine ligand 5; IL-8, Interleukin 8, VEGF-1, vascular endothelium-derived growth factor-1; pg/mL, picograms/millilitre, ng/mL: nanogram/millilitre.
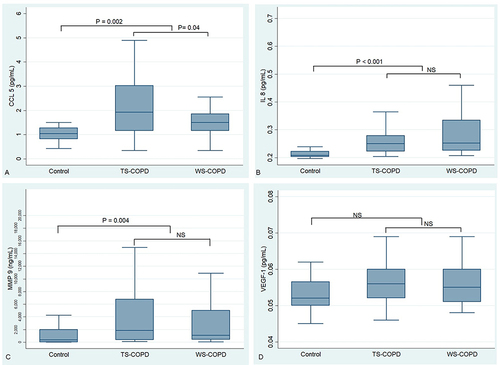
Table 3 Correlation Between the Levels of Biomarkers and the Degree of Airflow Obstruction