Figures & data
Table 1 Patient demographics
Figure 1 Course of the mean FEV1, BORG, CCQ total and domain scores, and SGRQ total and domain scores.
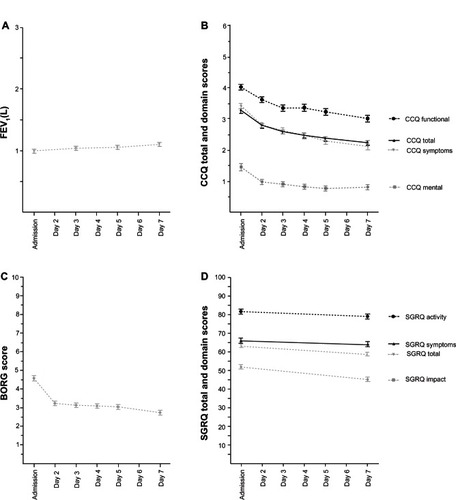
Figure 2 Mean change in minimal clinically important differences of FEV1, BORG, CCQ, and SGRQ.
Abbreviations: FEV1, forced expiratory flow in one second; CCQ, Clinical COPD Questionnaire; COPD, chronic obstructive pulmonary disease; SGRQ, St George’s Respiratory Questionnaire; n, number of patients completed the measurement; MCID, minimal clinically important difference.
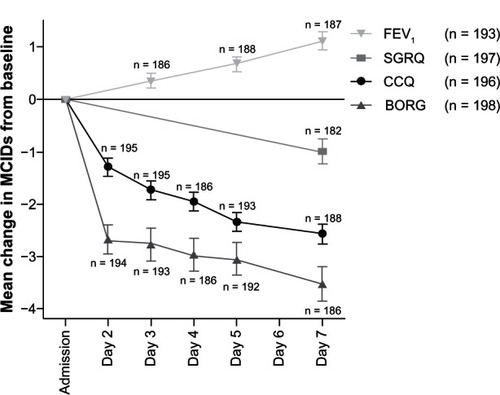
Table 2 Responsiveness of patient-reported outcomes and lung function on day 7
Figure 3 Course of Clinical COPD Questionnaire total scores in hospitalized patients and outpatients during recovery from an exacerbation of COPD.
Abbreviation: COPD, chronic obstructive pulmonary disease.
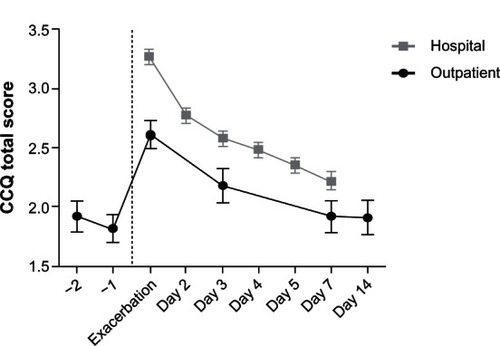
Table 3 Cox regression models describing prediction of treatment failure
Figure 4 Cox survival curve for re-exacerbation within a year, beginning at six weeks after hospitalization.
Abbreviations: CCQ, Clinical COPD Questionnaire; COPD, chronic obstructive pulmonary disease.
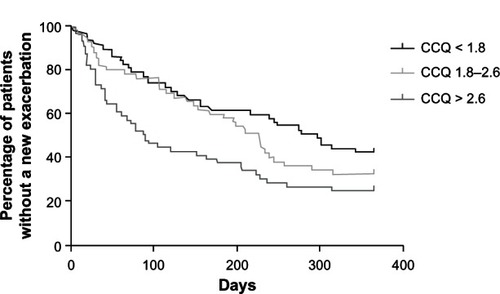
Figure 5 Proportion of patients alive after hospitalization for an exacerbation of COPD (CCQ score < 1.8; 1.8–2.6;>2.6).
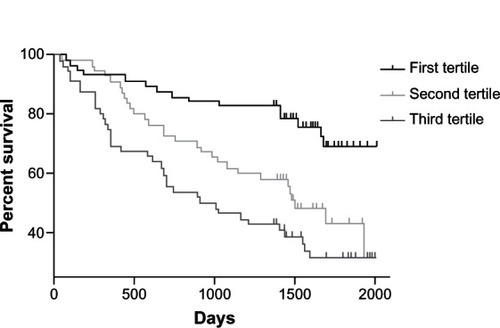
Table A1 Cox regression models: treatment failure
Table A2 Cox regression models: time to exacerbation
Table A3 Cox regression models: mortality