Figures & data
Figure 1 The detailed analysis process of this study.
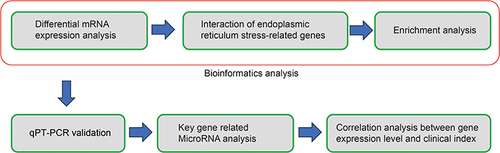
Table 1 The Specific Expression Levels of ERS-Related Genes
Figure 2 Screening of ERS-related genes in COPD and healthy samples.
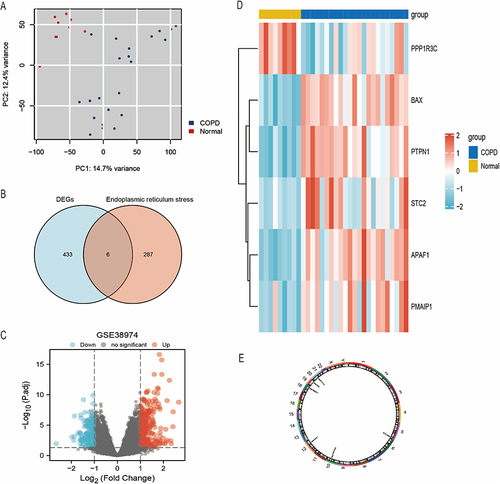
Figure 3 Expressions of ERS-related genes in the GSE38974 dataset. **Indicates p<0.01, ***Indicates p < 0.001.
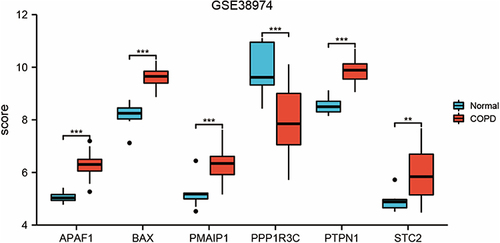
Figure 4 The interaction relationship of ERS-related genes. *Indicates p< 0.05, **Indicates p<0.01.
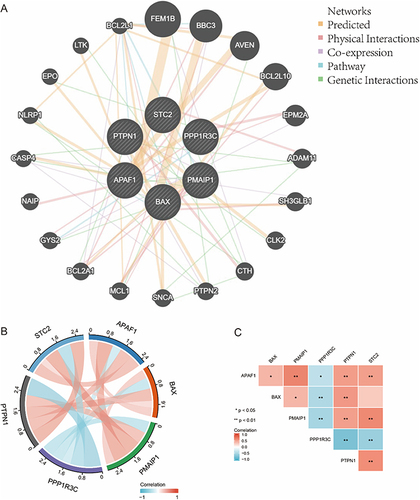
Figure 5 Enrichment analysis of ERS genes.
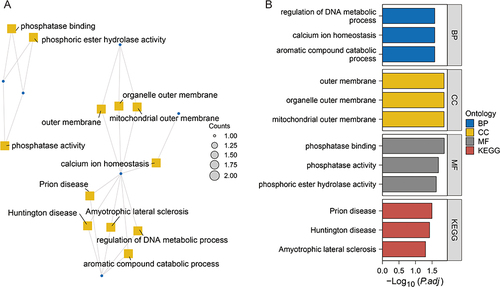
Figure 6 GSEA pathway enrichment analysis of ERS genes.
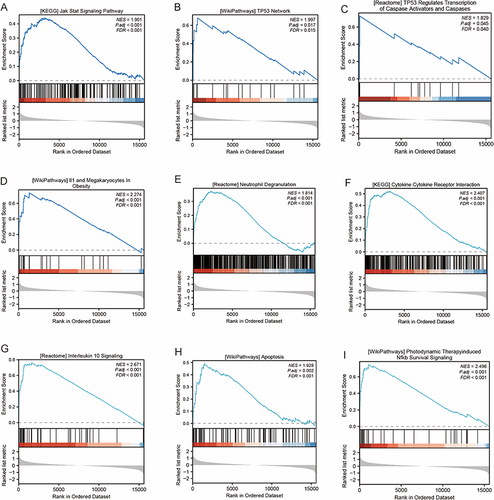
Table 2 Correlation Analysis Between the ERS-Related Gene Expression Levels and Clinical Indicators
Figure 7 The qRT-PCR validation of key genes clinical samples. *Indicates p< 0.05, ***Indicates p < 0.001, ****Indicates p < 0.0001.
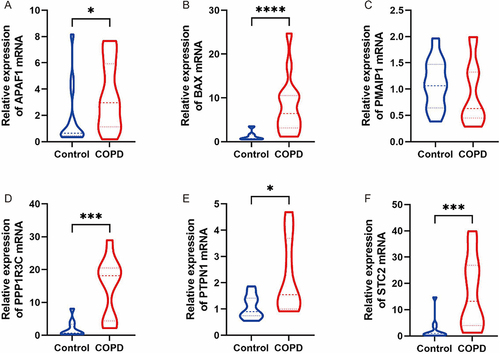
Figure 8 Key genes-related MicroRNA analysis.
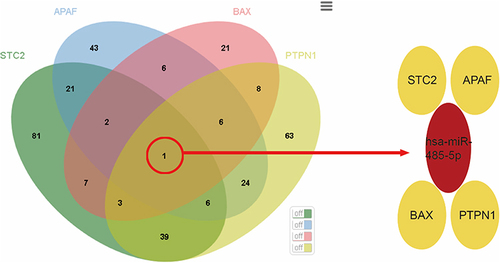
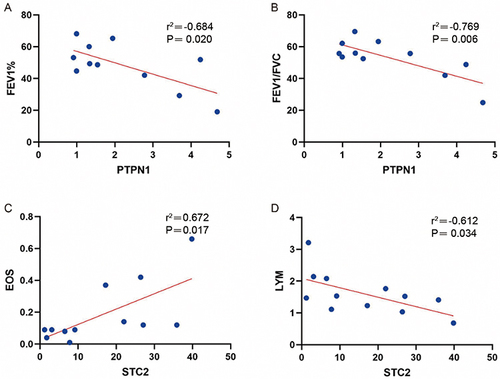
Figure 9 Correlation analysis between PTPN1 and STC2 and pulmonary function indicators (EOS and LYM).