Figures & data
Table 1 General Clinical Characteristics of All Subjects
Table 2 Comparison of ApoA1, ApoB, and ApoA1/B Ratio Between Control Group and Experiment Group
Table 3 Comparison of Indices Between Groups in COPD Patients with Acute Lower Respiratory Tract Infection
Table 4 Correlation of Various Factors with COPD Complicated by Acute Lower Respiratory Bacterial Infection
Figure 1 Binary logistic regression analysis of COPD patients with acute lower respiratory tract infection.
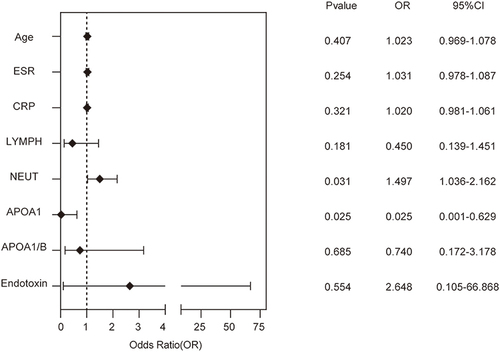
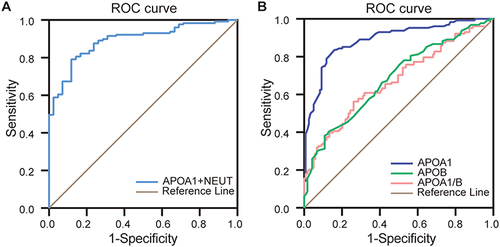
Figure 2 ROC curve of COPD complicated by acute lower respiratory tract bacterial infection. (A) ROC curve of NEUT and ApoA1 combined diagnosis of COPD with acute lower respiratory tract bacterial infection. (B) ROC curves of ApoA1, ApoB, and ApoA1/B respectively diagnosing COPD with acute lower respiratory tract bacterial infection in the whole data set.