Figures & data
Table 1 Comparison of Basic Data Between Group with Energy Met the Standards and Group with Energy Did Not Meet the Standards
Table 2 Comparison of Initial Auxiliary Examinations Between Group with Energy Met the Standards and Group with Energy Did Not Meet the Standards
Table 3 Comparison of Secondary Auxiliary Examination Data Between Group with Energy Met the Standards and Group with Energy Did Not Meet the Standards
Table 4 Comparison of the Difference in Auxiliary Examination Between Group with Energy Met the Standards and Group with Energy Did Not Meet the Standards
Figure 1 Bar graph of PNI differences between the Energy Standard Group and the Non-Energy Standard Group across two auxiliary examinations.
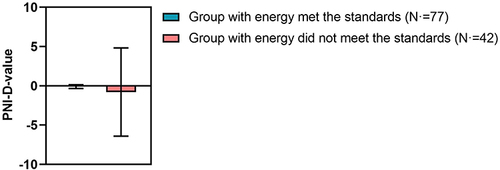
Figure 2 Bar graph of Albumin differences between the Energy Standard Group and the Non-Energy Standard Group across two auxiliary examinations.
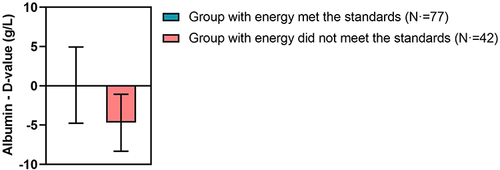
Figure 3 Bar graph of Prealbumin differences between the Energy Standard Group and the Non-Energy Standard Group across two auxiliary examinations.
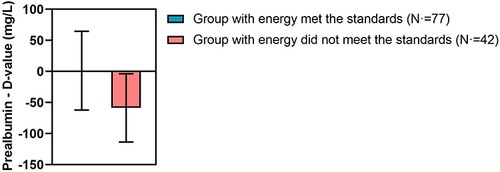
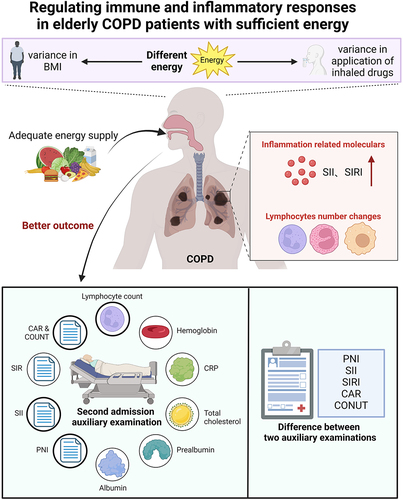
Figure 4 Schematic diagram of how adequate energy regulates immune and inflammatory responses in elderly COPD patients.