
Figures & data
Figure 1 Risk factors selection by LASSO. (A) Determine the best lambda (λ) in the LASSO model using 10-fold cross-validation in the training cohort. (B) LASSO coefficient profiles (vertical axis) of the 18 variables in the training cohort. The upper horizontal axis represents the number of variables with non-zero coefficients in the model, while the lower horizontal axis represents log(λ).
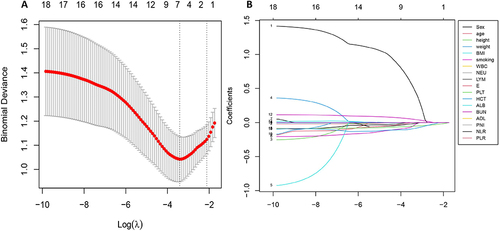
Table 1 Characteristics of AECOPD Patients in All Three Cohorts
Table 2 Independent Predictors Associated with Hypercapnic Respiratory Failure by Multivariate Analysis
Figure 2 Nomogram forecasting hypercapnic respiratory failure in AECOPD patients.
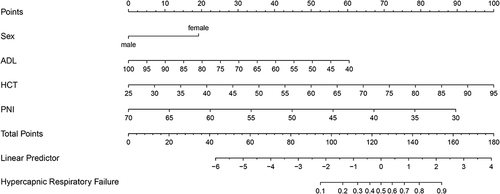
Figure 3 Dynamic Nomogram forecasting hypercapnic respiratory failure in AECOPD patients (https://a18895635453.shinyapps.io/dynnomapp/).
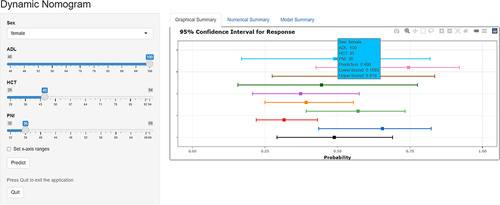
Table 3 Detailed Metrics in All Three Cohorts
Figure 4 ROC curves in the training, internal validation, and external validation cohorts.
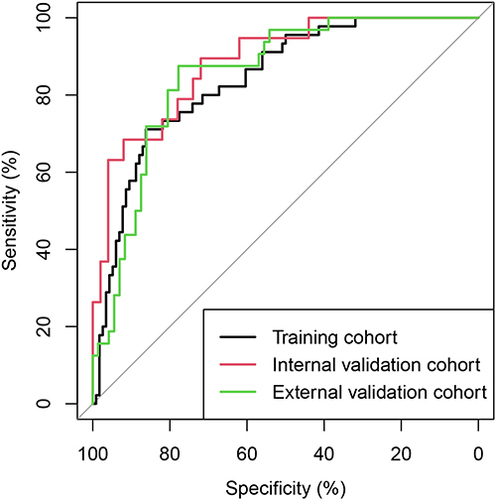
Figure 5 Calibration curves of the nomogram. The diagonal dashed line is the ideal calibration line, while the solid line is the actual line predicted by the nomogram. The closer the actual line is to the ideal line, the higher the calibration of the nomogram. (A) training cohort. (B) internal validation cohort. (C) external validation cohort.
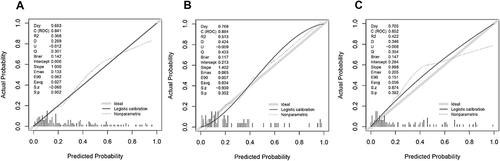
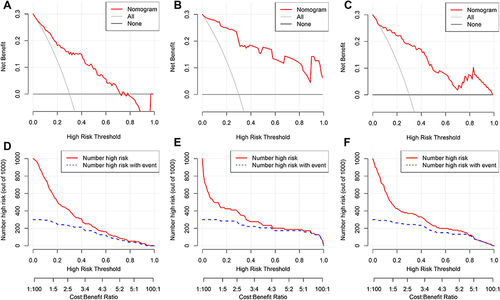
Figure 6 Clinical utility evaluation of the nomogram. DCA in the training cohort (A) internal validation cohort (B) and external validation cohort (C). CIC in the training cohort (D) internal validation cohort (E) and external validation cohort (F).
Data Sharing Statement
The de-characterized data included in this study can be obtained from the corresponding author upon reasonable request.