Figures & data
Table 1 Patient baseline demography and disease characteristics (FAS population; N = 4435)
Figure 1 Disposition of study patients.
Abbreviations: FAS, full analysis set; N, total number; n, sample number; PPS, per-protocol set; SGRQ, St George’s Respiratory Questionnaire; TS, treated set.
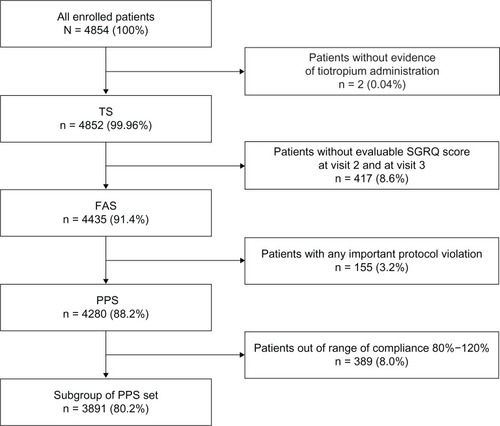
Figure 2 Summary change from baseline in SGRQ total scores, activity domain, impact domain, and symptom domain (FAS population).
Notes: Summary change from baseline in (A) SGRQ total scores, (B) activity domain, (C) impact domain, and (D) symptom domain (FAS population).
Abbreviations: FAS, full analysis set; SGRQ, St George’s Respiratory Questionnaire.
Abbreviations: FAS, full analysis set; SGRQ, St George’s Respiratory Questionnaire.
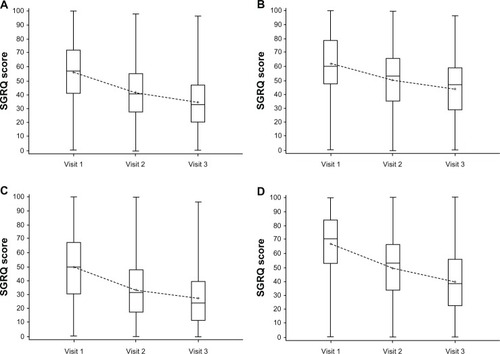
Figure 3 Summary change from baseline in SGRQ total scores among COPD patients.
Notes: Summary change from baseline in SGRQ total scores among COPD patients in (A) participating countries, (B) current or exsmokers and nonsmokers, (C) compliant or noncompliant, and (D) with and without cardiac comorbidities. Bars show mean values of SGRQ scores. Number of patients is shown on bottom of bars. The negative number of capsules means that the patient had taken less capsules and vice versa. The patient is considered as noncompliant if the difference between the number of days and actual number of capsules taken between visit 1 and visit 2 or visit 2 and visit 3 is ≥10 capsules.
Abbreviations: COPD, chronic obstructive pulmonary disease; CR, Croatia; PL, Poland; RO, Romania; RU, Russian Federation; SD, standard deviation; SGRQ, St George’s Respiratory Questionnaire; SI, Slovenia; SK, Slovakia.
Abbreviations: COPD, chronic obstructive pulmonary disease; CR, Croatia; PL, Poland; RO, Romania; RU, Russian Federation; SD, standard deviation; SGRQ, St George’s Respiratory Questionnaire; SI, Slovenia; SK, Slovakia.
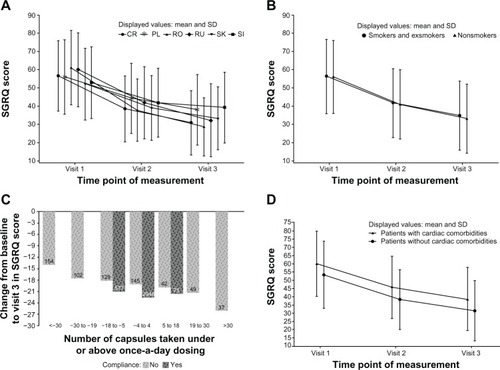
Table 2 Summary of patients SGRQ status and the association between characteristic of patients and relative improvement in SGRQ score within 6 months – FAS
Table 3 Summary of reported AEs (TS population; N = 4852)