Figures & data
Figure 1 QCT evaluation using 3D slicer software. (A and B) Density evaluation based on %LAA−950 after lung segmentation to define emphysema. (C) Airway evaluation in the third generation of the right lung resulting in %WA. (D) An HRCT axial view, mediastinum window to measure PA:A ratio and (E) Measurement PMA and PMD on the level right above the aortic arch showing pectoralis muscle segmentation (bright red = major pectoralis muscle; brownish red = minor pectoralis muscle).
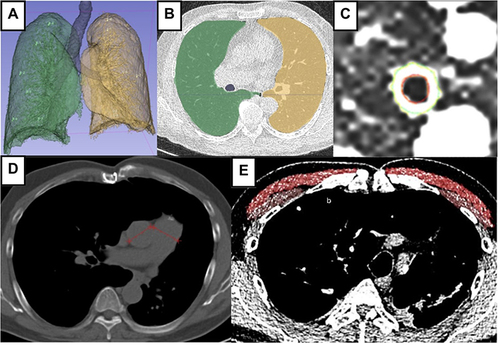
Table 1 Participants’ Characteristics
Table 2 Correlation of QCT Parameters, Lung Function, HIF-1α, and Clinical Factors with MoCA-Ina Score
Table 3 Comparison of QCT Parameters, Lung Function, HIF-1α, and Clinical Factors with MoCA-Ina Score
Table 4 Predictor Value Toward CI
Table 5 Qualification Measurement of Path Analysis with Cognitive Impairment
Table 6 The Regression Coefficient of Path Analysis with Cognitive Impairment
Figure 2 Path analysis model with cognitive impairment. Both %LAA−950 and education duration directly and indirectly through FEV1 pp contribute to CI development.
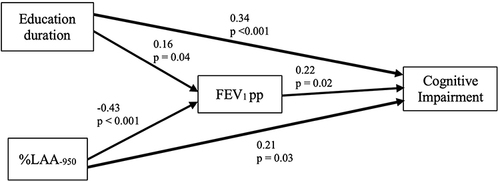
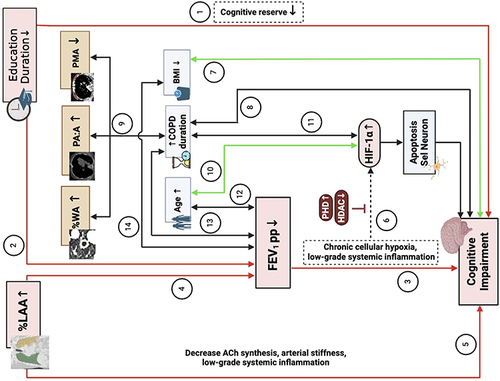
Figure 3 Proposed Mechanism of CI Development in COPD. ① Duration of education affects directly in CI, ② Duration of education affects indirectly in CI through FEV1 pp, ③ FEV1 pp affects directly in CI, ④ %LAA indirectly affects in CI through FEV1 pp, ⑤ %LAA directly affects in CI, ⑥ Chronic cellular hypoxia and low-grade inflammation induce HIF-1α expression that cause neuron cell apoptosis and CI, ⑦ BMI correlates with CI, ⑧ Duration of COPD correlates with CI, ⑨ Duration of COPD that correlates with %WA, PA:A, and PM, ⑩ Age correlates with HIF-1α, ⑪ Duration of COPD correlates with CI, ⑫ Age correlates with FEV1, ⑬ Duration of COPD correlates with FEV1, ⑭ BMI correlates with FEV1.