Figures & data
Figure 1 Changes in number of high grade and nonhigh grade COPD patients during the years 2006–2010.
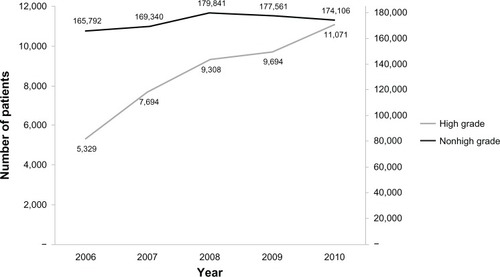
Table 1 Sociodemographic and clinical characteristics of patients studied
Table 2 Health care resource utilization of COPD patients according to grade of disease
Table 3 Comparison of different components of medical cost between high grade and nonhigh grade COPD patients (per patient)
Table 4 Pattern of COPD related drug use and costs by grade
Table 5 Multiple linear regression for factors affecting days of health care use