Figures & data
Table 1 Flowchart describing visits and tests
Table 2 Patient characteristics at baseline
Figure 1 Changes in iRaw and iVaw for all patients.
Abbreviations: iRaw, image-based resistance; iVaw, image-based volume.
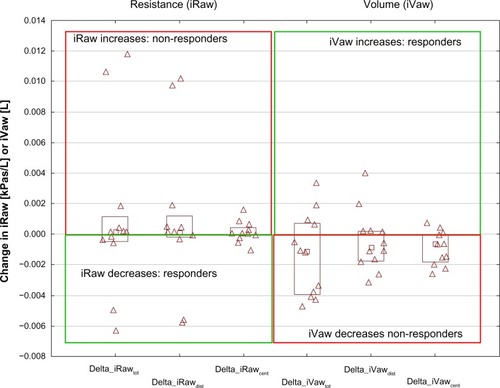
Figure 2 Changes in iRaw after 3 months of treatment with NAC (top) and placebo (bottom) in iRaw responders.
Abbreviations: NAC, N-acetylcysteine; iRaw, image-based resistance.
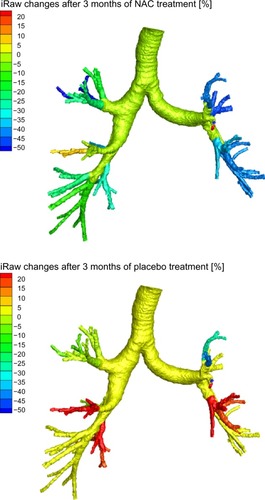
Figure 3 Changes in iRaw after 3 months of treatment with NAC (top) and placebo (bottom) in an iRaw nonresponder.
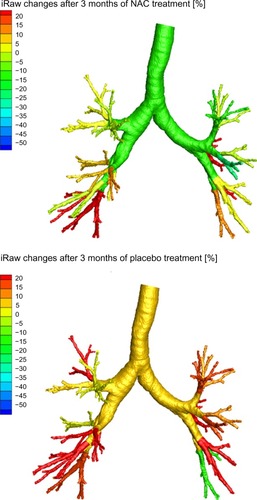
Figure 4 Significant correlation between change in computational fluid dynamics-based resistance of the central airways, iRawcent, and glutathione levels after NAC treatment.
Abbreviations: iRaw, image-based resistance; GSH, glutathione; NAC, N-acetylcysteine.
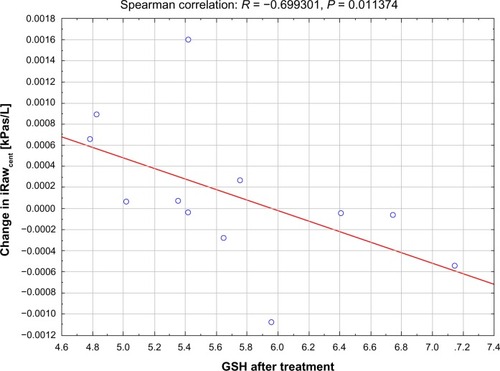
Figure 5 Significant correlation between change in computational fluid dynamics-based resistance of the distal airways iRawdist and level of GPx at baseline (top) and after placebo (bottom).
Abbreviations: iRaw, image-based resistance; GPx, glutathione peroxidase.
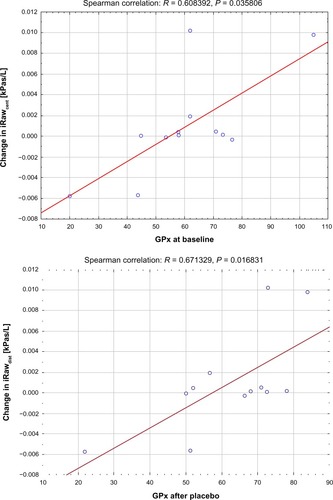
Figure 6 Glutathione after NAC treatment was significantly different for patients who experienced a decrease in iRawcent (top) and an increase in iVawcent (bottom).
Abbreviations: iRaw, image-based resistance; GSH, glutathione; iVaw, image-based volume.
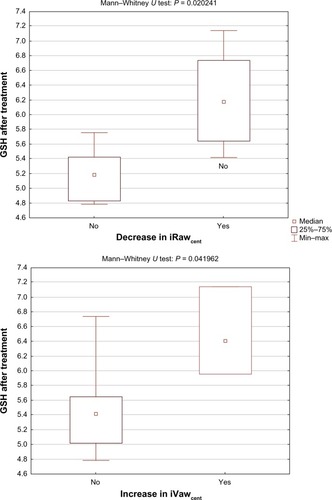
Figure 7 Significant difference in change in GPx between responders and nonresponders in terms of iRawtot (top) and no significant difference in change in GPx between responders and nonresponders in terms of FEV1 (bottom).
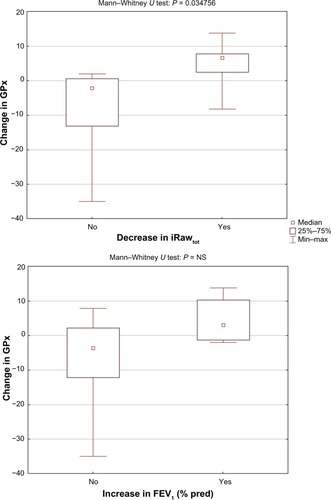
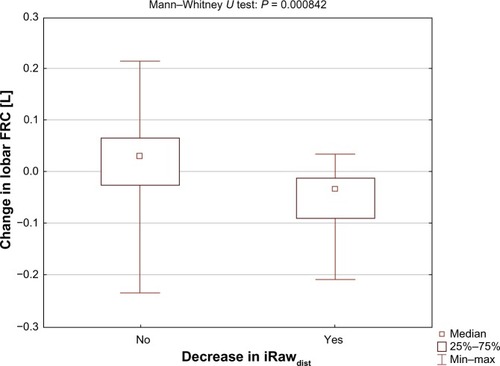
Table 3 Lobar inspiratory capacity decreased significantly after placebo and increased after treatment with NAC in patients with a reduction in iRawdist < 0.002 kPa/L
Figure 8 Significant difference in reduction of hyperinflation (lobar FRC volumes) between responders and nonresponders in terms of iRawdist.