Figures & data
Figure 1 BEACON study design.
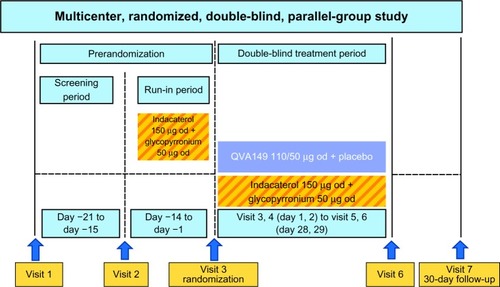
Table 1 Demographics and clinical characteristics of patients at baseline
Figure 2 Patient disposition.
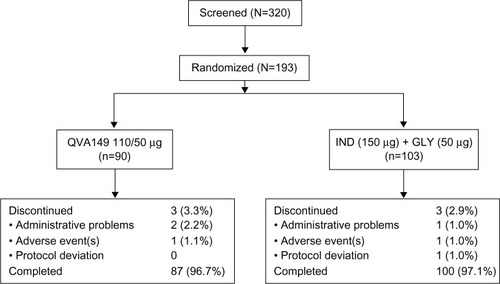
Figure 3 Trough FEV1 (L) at week 4.
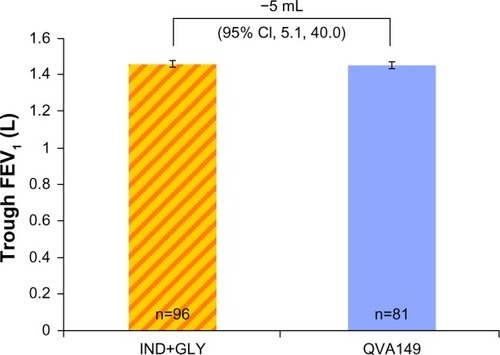
Table 2 Daily total symptom score and rescue medication use over 4 weeks
Figure 4 FEV1 AUC0–4 hours at day 1 and week 4.
Abbreviations: FEV1, forced expiratory volume in 1 second; AUC, area under curve; IND+GLY, indacaterol and glycopyrronium; CI, confidence interval.
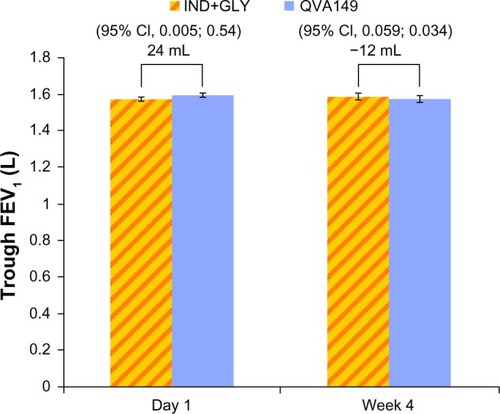
Figure 5 FEV1 for the first 4 hours at week 4.
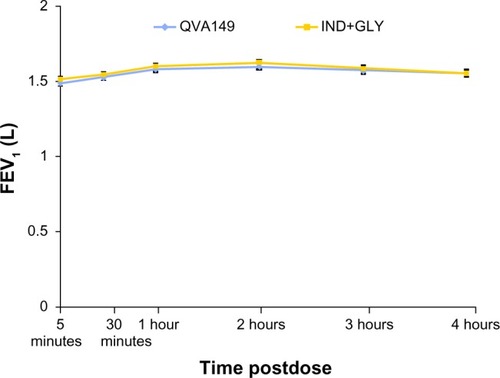
Table 3 Most frequent AEs (at least 1% in any treatment group) by preferred term of patients
Table 4 Number (%) of patients with newly occurring or worsening notable QTc values (according to Fridericia’s formula) and maximum increase from baseline on study treatment