Figures & data
Table 1 Baseline demographics of the study groups
Table 2 Changes in the 6-minute walk test, at baseline and after 4 weeks
Table 3 Change in ventilatory parameters, at baseline and after 4 weeks
Figure 1 Amount of change in VC for each patient for the pulmonary function test.
Notes: aP=0.077 compared with the control, analyzed by unpaired t-test. Data are presented as means ± SD.
Abbreviations: SD, standard deviation; VC, vital capacity; L, Liter.
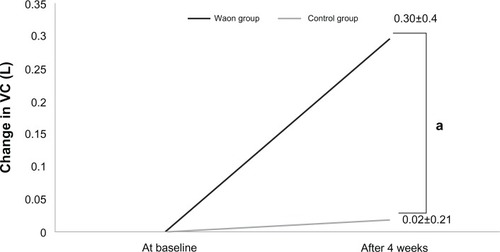
Figure 2 Amount of change in PEF for each patient for the pulmonary function test.
Notes: bP=0.095 compared with the control, analyzed by unpaired t-test. Data are presented as means ± SD.
Abbreviations: SD, standard deviation; PEF, peak expiratory flow; L/s, Liter per second.
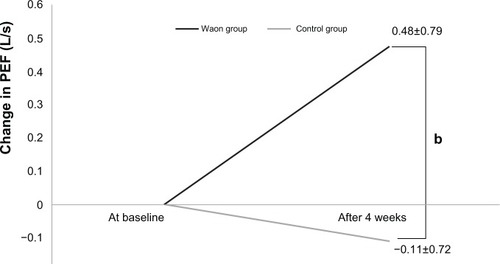
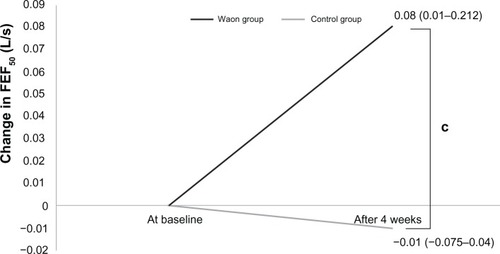
Figure 3 Amount of change in FEF50 for each patient for the pulmonary function test.
Abbreviations: FEF50, forced expiratory flow after 50% of expired forced vital capacity; L/s, Liter per second.