Figures & data
Figure 1 Potential mechanisms leading to relative pulmonary arterial enlargement in COPD.
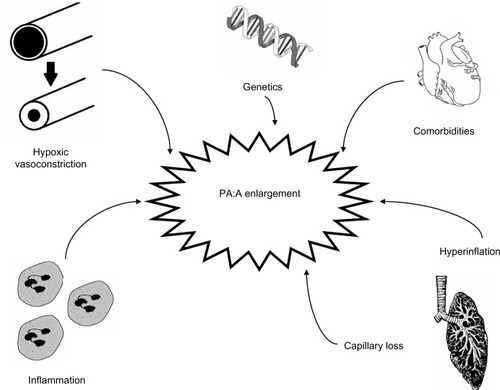
Table 1 Interobserver and intraobserver agreement in measuring the pulmonary artery and the PA:A ratio
Figure 2 Measurement of the pulmonary artery (PA) and ascending aorta (A) diameters at the level of the PA bifurcation. PA diameter = line (A) (43.0 mm) and A diameter = average of lines (B) + (C) (39.6 mm) result in a PA:A ratio >1.
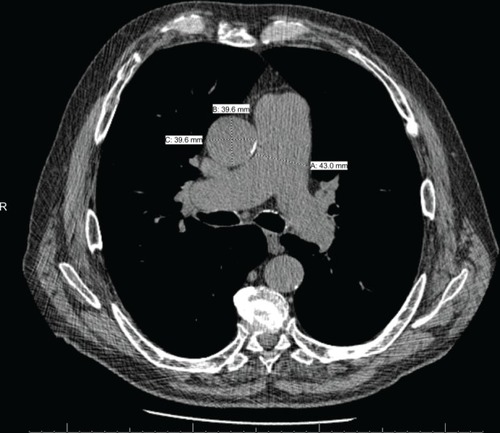
Table 2 Reference values for pulmonary artery diameter and PA:A ratio
Table 3 Correlation between PA diameter measured by CT, PA:A ratio, and hemodynamics
Table 4 Utility of the PA:A ratio in diagnosis of pulmonary hypertension
Figure 3 Scatter plots show relationships between mPAP and (A) PA:A ratio (n=60, r=0.55, P<0.001) and (B) echo-derived PASP (n=38, r=0.33, P=0.04).
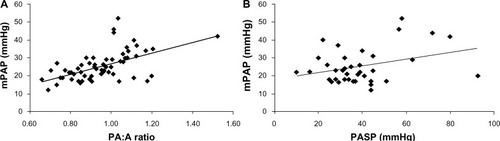
Table 5 Outcomes related to PA:A ratio