Figures & data
Figure 1 Computed tomography images of phantoms by high-resolution CT, ultrahigh-resolution CT, and ultrahigh-resolution CT with iDose4 (Philips Healthcare) software.
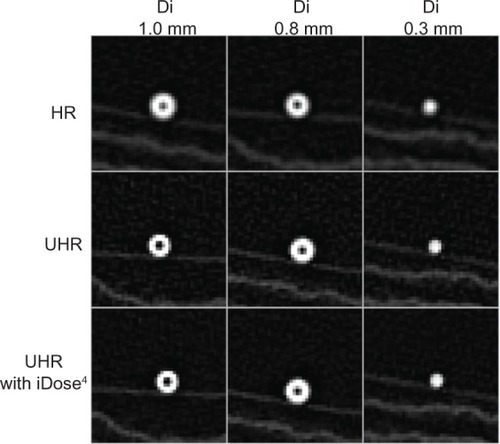
Figure 2 Comparison of conventional view of ultrahigh-resolution CT, reconstructed longitudinal airway view, and perpendicular image of airway axis in two patients with chronic obstructive pulmonary disease. (A–C) Patient 1 and (D–F) patient 2.
Abbreviation: CT, computed tomography.
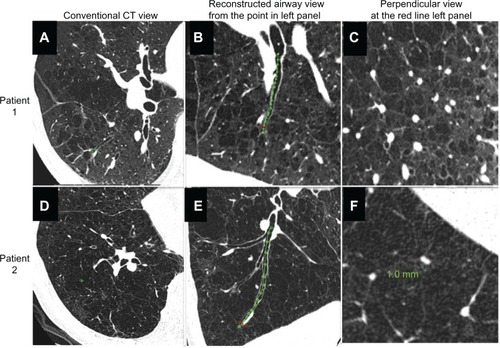
Figure 3 Definition of measurement area in computed tomography images of airways in patients with chronic obstructive pulmonary disease. (A) Longitudinal image of right B9a. Central zone (C) was defined as the point 2 cm from the entrance to the segmental bronchus; peripheral zone (P) was defined as the point 2 cm from the pleura; and middle zone (M) was defined as the point halfway between P and C. (B–D) Images exactly perpendicular to airway axis at each point (part B shows central zone; part C shows middle zone; and part D shows peripheral zone). The 3 cm circle indicates the selected airway. Within this circle, we measured the percentage of low attenuation area, number of bronchi, number of vessel structures, and the inner diameter of the center airway.
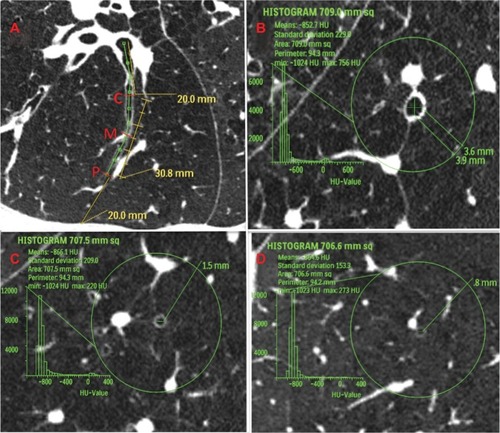
Table 1 Comparison of 70 male patients with COPD and 15 male controlsTable Footnotea
Figure 4 Computed tomography images of severe emphysema and airway lumen-obliterated emphysema. (A) Reconstructed image of longitudinal airway view of severe emphysema with little parenchyma around septum or vessels (arrows indicate the point where image B was reconstructed within 2 cm from pleura). (B) Reconstructed image of view exactly perpendicular image to airway axis at red line in panel A (arrows indicate the airway used for image reconstruction). Even in peripheral airway within 2 cm from the pleura airway lumens could be observed. Green line indicates the size of the airway. (C) Reconstructed image of longitudinal airway view of airway lumen-obliterated emphysema. The airway lumen is obliterated at the proximal levels of the bronchi (>2 cm apart from the surface of the lung), and subsegmental areas lacking parenchyma were observed. The obliterated bronchus could be traced into the air-trapped emphysematous area (arrows indicate the point where image D was reconstructed). (D) Reconstructed image of view exactly perpendicular to the long axis of the bronchus at the red line in panel C. Red circle indicates the airway which was used for image reconstruction.
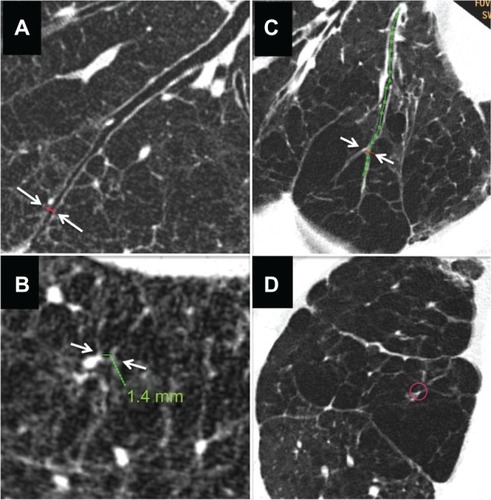
Figure 5 Three cases of airway lumen-obliterated emphysema. (A, C and E) Reconstructed images of longitudinal airway view of airway lumen-obliterated emphysema. Red lines indicate the points where perpendicular images were reconstructed. (B, D and F) Reconstructed images of view exactly perpendicular image to airway axis at red lines in panel A, C, and E, respectively.
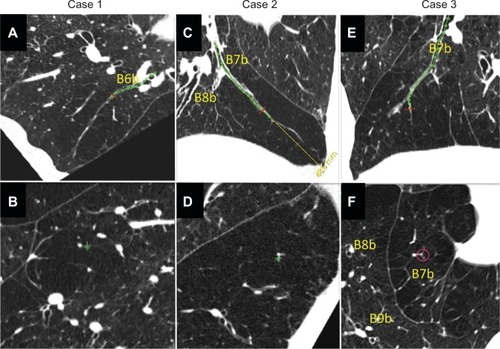
Figure 6 Percentage of low attenuation area, number of airways, number of vessels and airway inner diameter in patients with chronic obstructive pulmonary disease grouped by GOLD stage and compared with controls. Bar graphs show summaries of lung structures in the 3 cm circle around the selected bronchus measured in right B1 to B10 bronchi. Means and standard error bars are shown. The peripheral zone was defined as the point 2 cm from the pleura; the central zone was defined as the point 2 cm from the entrance to the segmental bronchus; the middle zone was designated as the point half-way between the peripheral and central zone. Analysis of variance was used to determine the overall difference among groups, and the Tukey–Kramer multiple comparison test was used to compare groups. Significances between the controls (normal) and each GOLD airflow limitation stage (I–IV) are shown. Asterisks indicate *P<0.05, **P<0.01, and ***P<0.001 compared with controls.
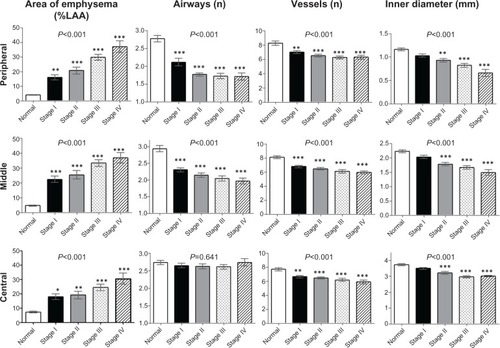
Figure 7 Segmental low attenuation area by GOLD stage and percentages of airway lumen-obliterated emphysema by GOLD stage. (Left panels) The segmental low attenuation area (LAA) is a mean of the LAA in the peripheral, middle, and central zones of each bronchus. Analysis of variance with the Tukey–Kramer multiple comparison test was used to compare groups. Asterisks indicate *P<0.05; **P<0.01; and ***P<0.001 compared with controls. (Right panels) The percentage of airway lumen-obliterated emphysema in each segment (part A) and according to GOLD airflow limitation stages (part B) were significantly different with the Kruskal–Wallis test.
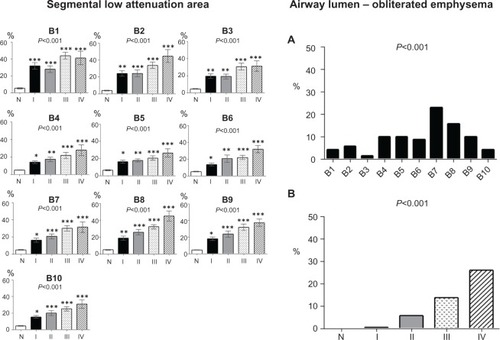
Table 2 Relationships between airway dimensions and pulmonary function in COPD
Table 3 Standard regression coefficients and correlation coefficient (r values) of stepwise multiple regression analysis for PFTs