
Figures & data
Figure 1 The explored associations between the study variables.
Abbreviation: COPD, chronic obstructive pulmonary disease.
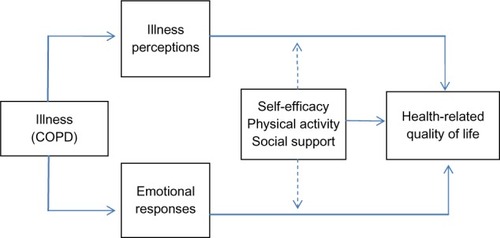
Table 1 The scoring of items measuring self-reported level of activity
Table 2 Characteristics of men and women in the sample at baseline (N=60)
Table 3 Bivariate associations between the study variables in the sample at baseline (N=60)
Table 4 Predictors of health-related quality of life at baseline and at one-year follow-up by hierarchical regression analysis (N=60)